As a beginner with Google Analytics, I sometimes find it difficult to check all the data on all levels, purposefully. When I am in this process, User Explorer is my favorite feature. Here’s what brought me to say that.
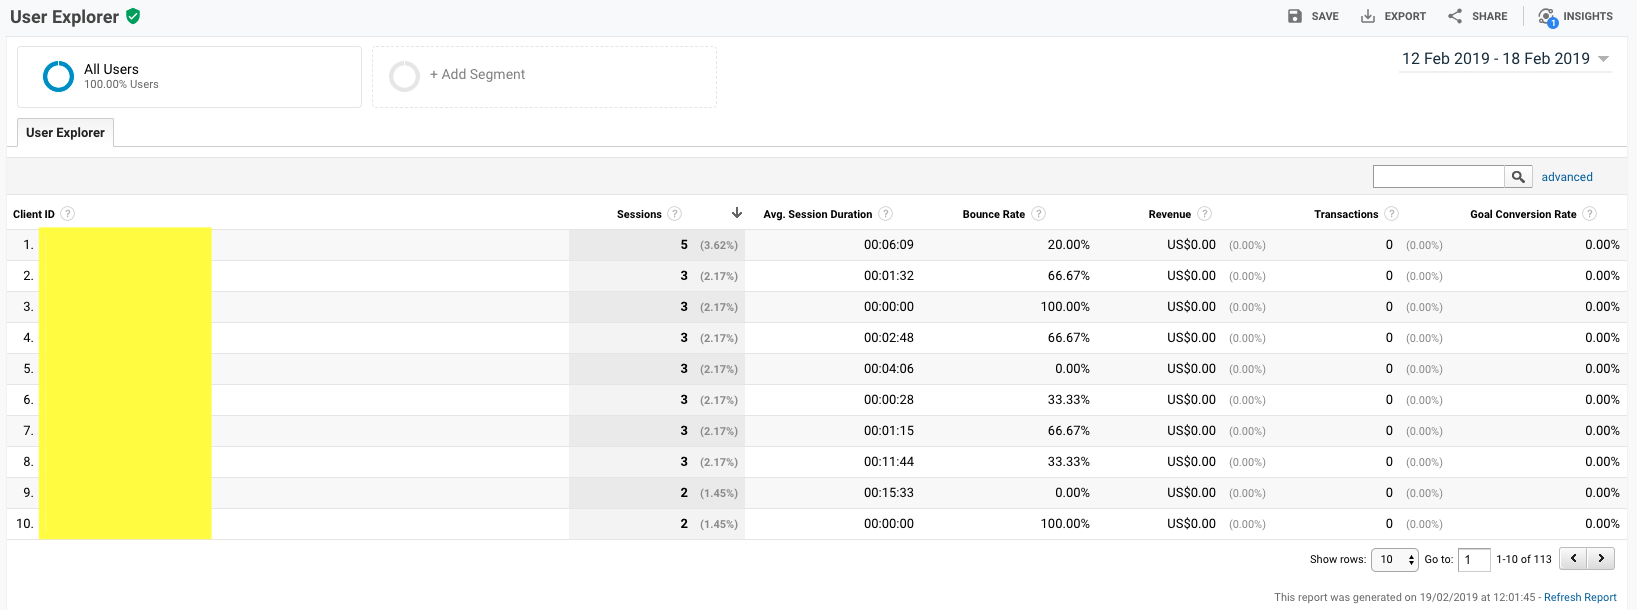
Google Analytics is an excellent way of checking website traffic. User Explorer is a report where you can see individual user behavior, on the session level. You can find it in Google Analytics as the last function in the Audience sector.
Why do I like it?
It’s an analysis on an individual basis. Although it can seem freaky to stalk on your visitors in this way, it’s a cool thing that you can see their actions and explore carefully. I find myself looking with interest at the journey – where it started, pages visited and where it ended.
Every user is hidden behind an anonymized ID, a must in the era of data protection. In this case, you can’t see if the said user is female or male, location, or any other detail. Anyhow, you can examine the actions of each user by a metric. You can see number of sessions (how many times the person has gone through the content), average session duration (how much time they spent on the site), bounce rate (how quickly they’ve left), revenue (if you have your store set up to accept payment) and goal conversion rate (the amount of percentage that the goals that you set are completed).
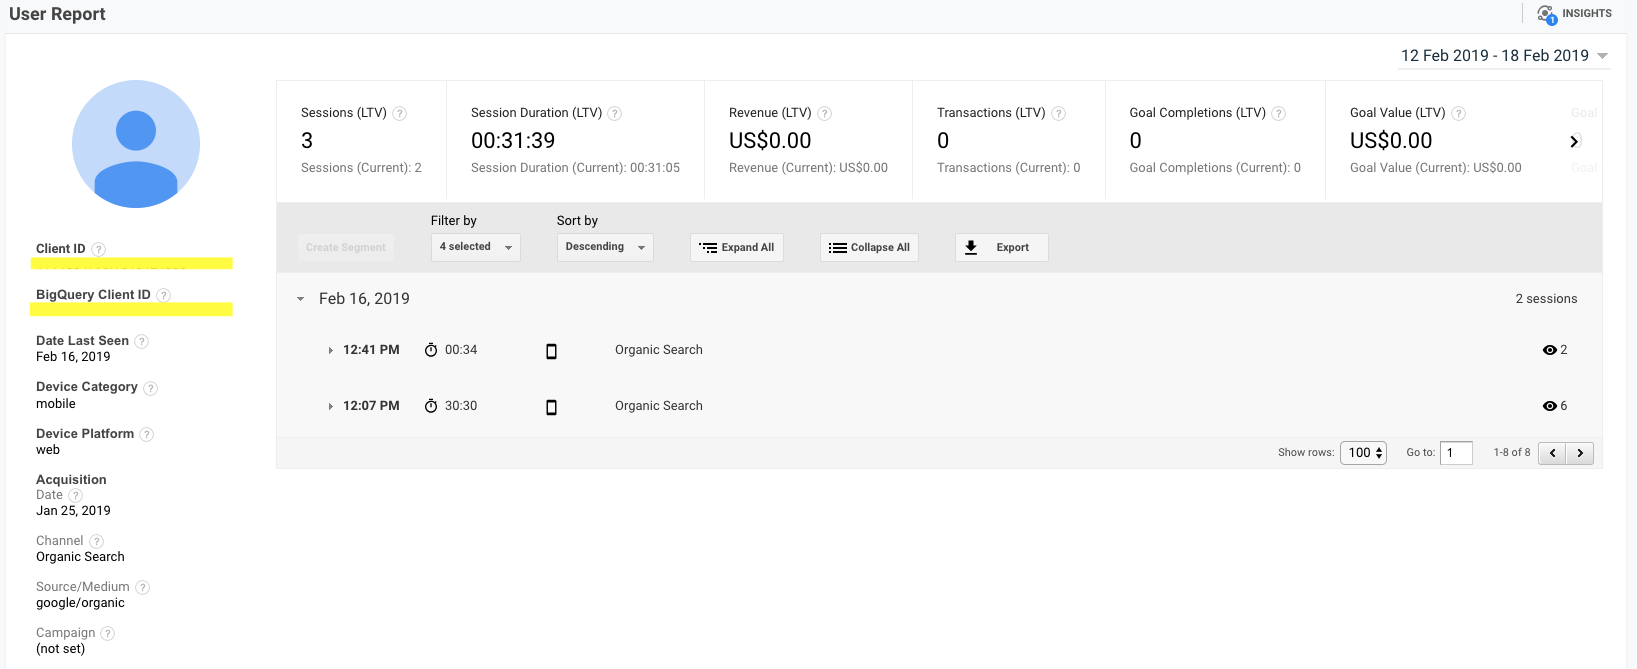
When you click on an ID, you can see more details about the session: the individual profile of the user, the first visit date, which devices they used, how they found you, and little symbols that suggest pageviews or different events.
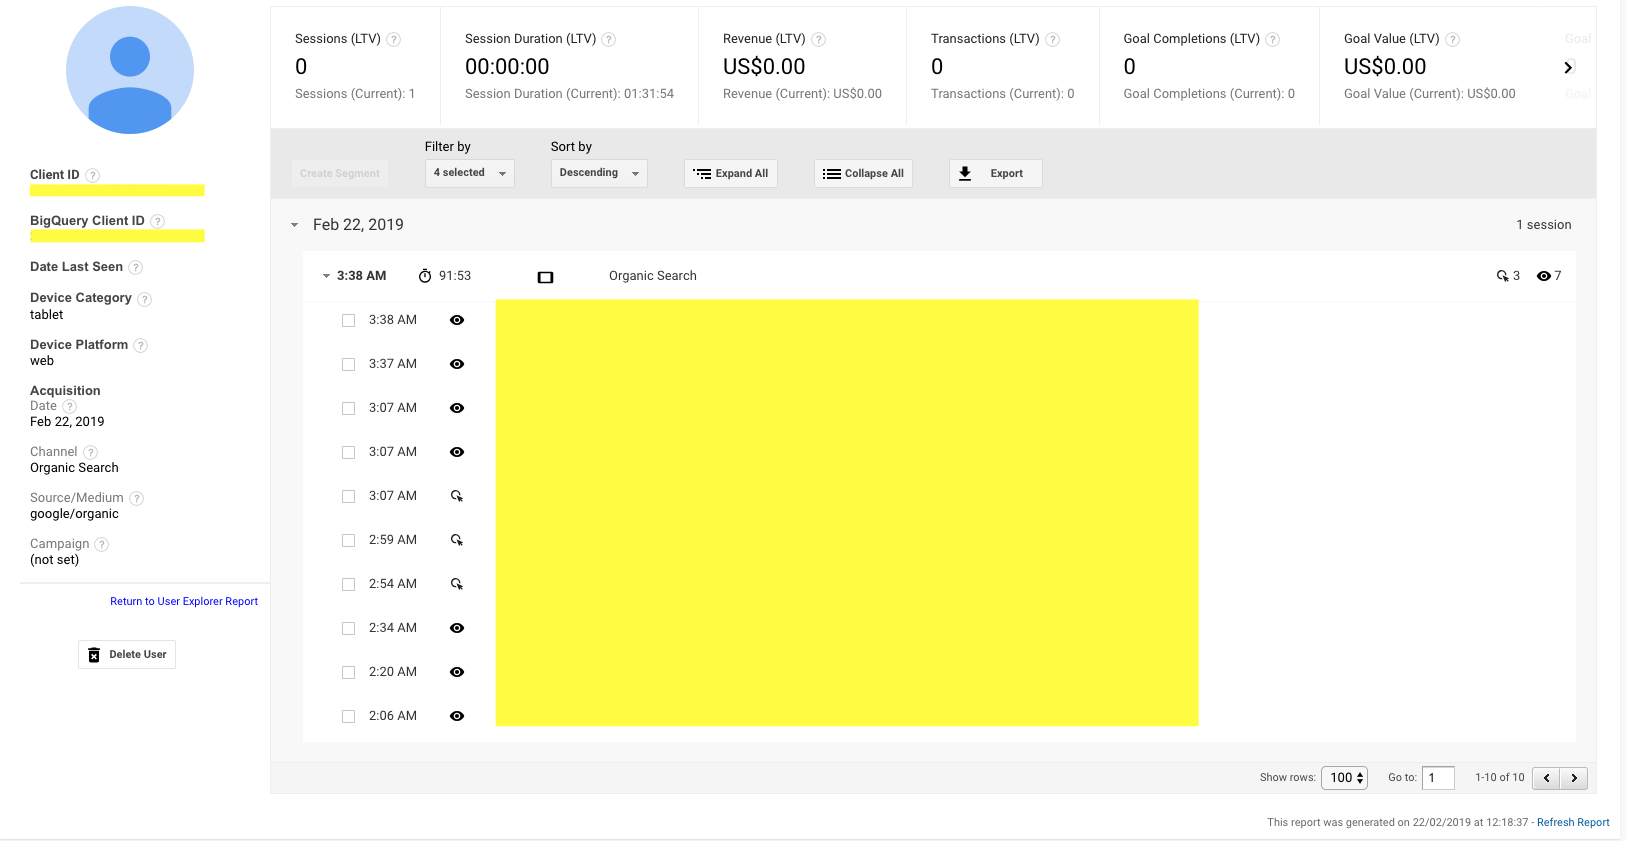
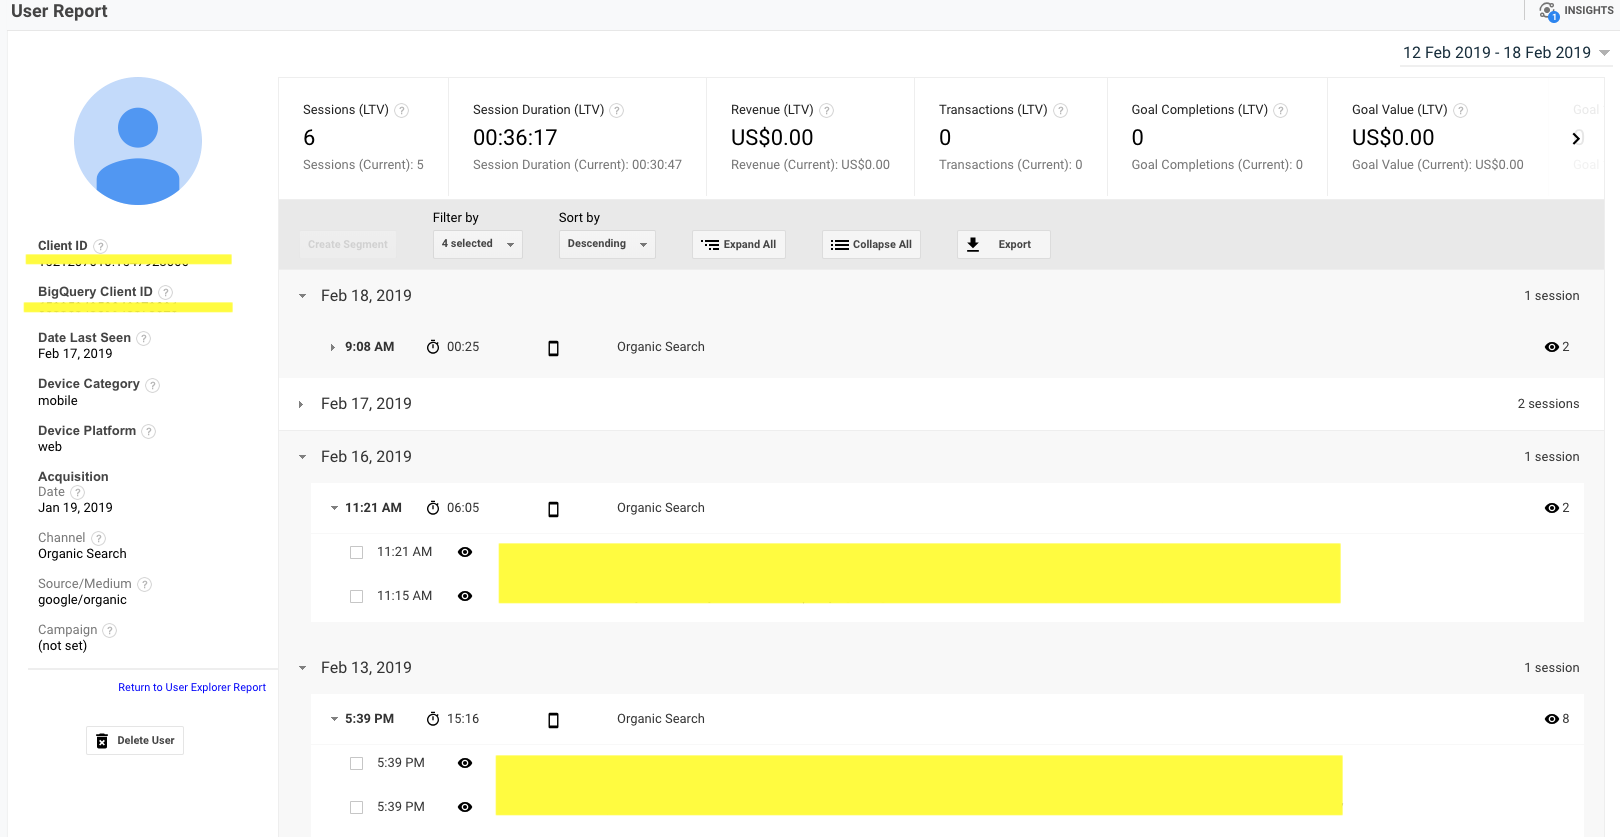
There is also the option to breakdown the journeys, to see the detailed dropdown session activity: the history of the user by session: how much time they spent, the device they used, and the source they came from. Next, you can check on the event level, to see the details (e.g., a purchase, walking through the site).
Tips & tricks
Create segments
Instead of trying to click through all of the IDs, set a custom segment to only view a particular action. The segment can be set based on any combination of actions; then it’s applied to your report to find the users that reacted in the same way on your site.
Use Lighthouse
Although I don’t know how moral this is, if emails are submitted to your site, you can use Lighthouse to connect with the random user IDs. This way you can match the user behavior with an identity.
Set proper filters
For an accurate check up you can filter the number of sessions from lowest to highest. If we’re talking about e-commerce, the first to check can be Revenue or Transaction. If we’re talking about non-e-commerce sites, blogs, for example, you might want to look at the average session duration.
Exclude yourself from tracking
You can stop Google Analytics from tracking your visits, for a more accurate analysis. There are multiple ways to do that. The one I chose is the simplest one, a Google Chrome extension, called “Block Yourself from Analytics.” You can install it from here!
What I don’t like about User Explorer
On mobile, User Explorer it’s unavailable, hence the experience does not compare with the desktop version.
I find it easy to see what triggered the user to do an action, what sat in their way to explore more or why they ended an action. It’s pretty useful with observing some patterns along the way, and for sure improving conversion rate, helping advertising campaigns or targeted remarketing.
Overall, I think User Explorer is an excellent help in observing actionable behavior, creating hypotheses and figuring out where an experience needs to be improved.