Hey, speed maniacs!
We designed two dashboards to help you track the speed of your site using Google Analytics or Google Data Studio.
If you don’t already know, Google Analytics has a site speed section where it tracks loading time metrics.
Since those reports are quite crowded, we thought it would be great do organize the data in a way that offers quick insight. And a super cool look 🙂
The dashboards we designed are based on the Average Page Load Time metric.
Here is the definition from Google:
Avg. Page Load Time is the average amount of time (in seconds) it takes for pages from the sample set to load, from initiation of the pageview (e.g. click on a page link) to load completion in the browser.
Also, to add more context to the speed metrics, we are using: new vs. returning visitors, devices, conversion rates and traffic volume.
Google Analytics Speed Dashboard
Here is the overview
The beauty of Google Analytics is that it offers a way to segment the data any way you want.
You can look at traffic from a particular source, buyers vs. non-buyers, bouncers and so on.
Now let’s look at each reporting widget
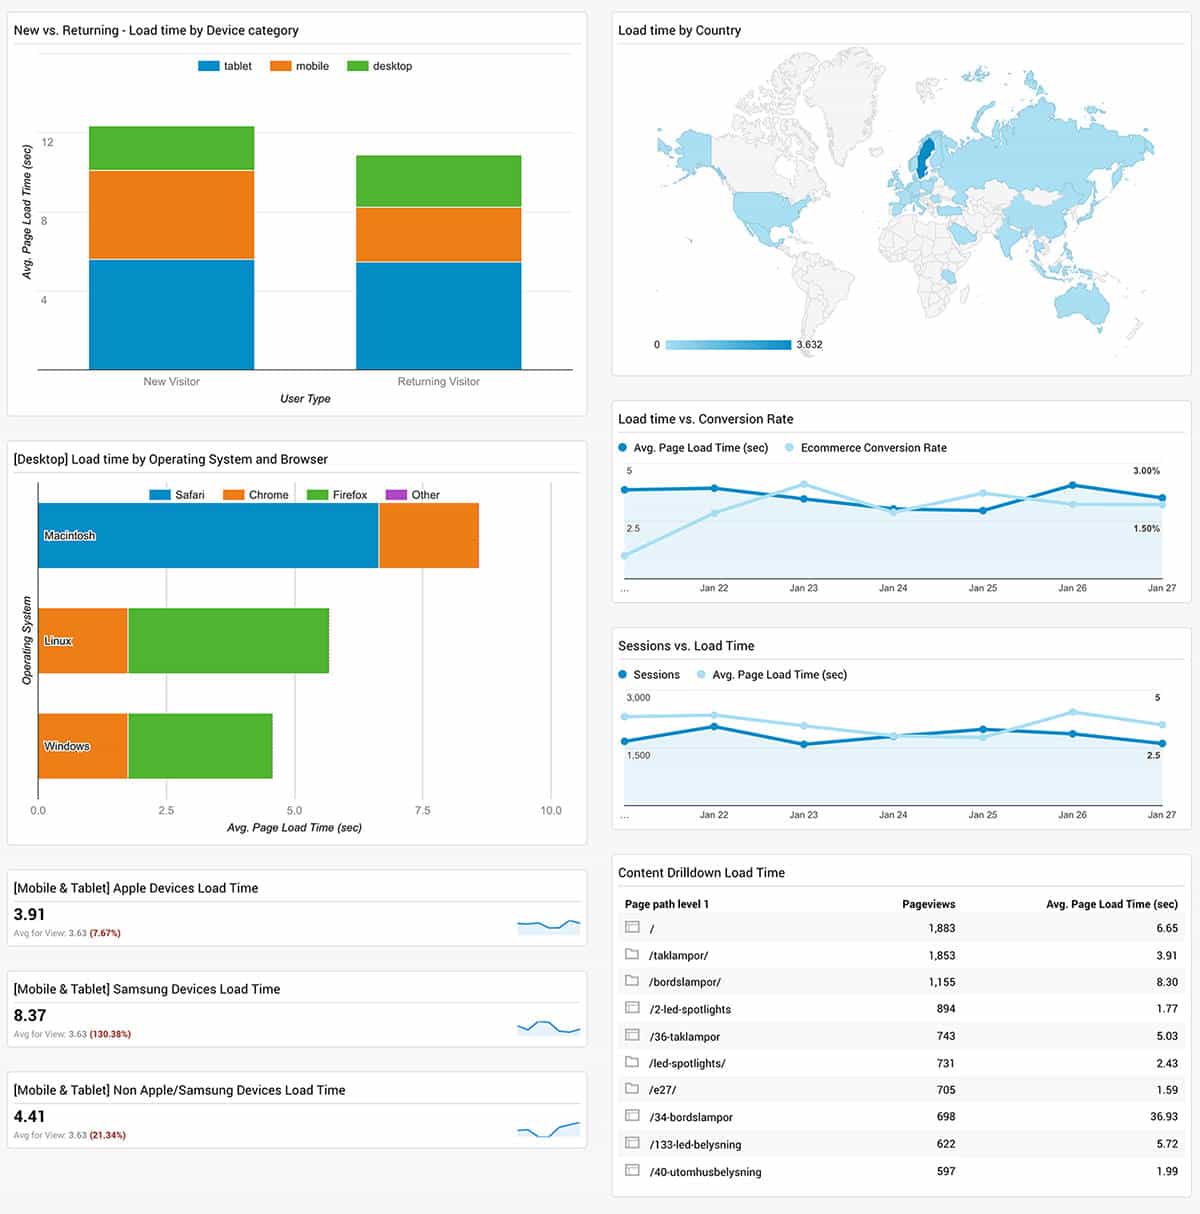
Loading time by device category split by New and Returning visitors
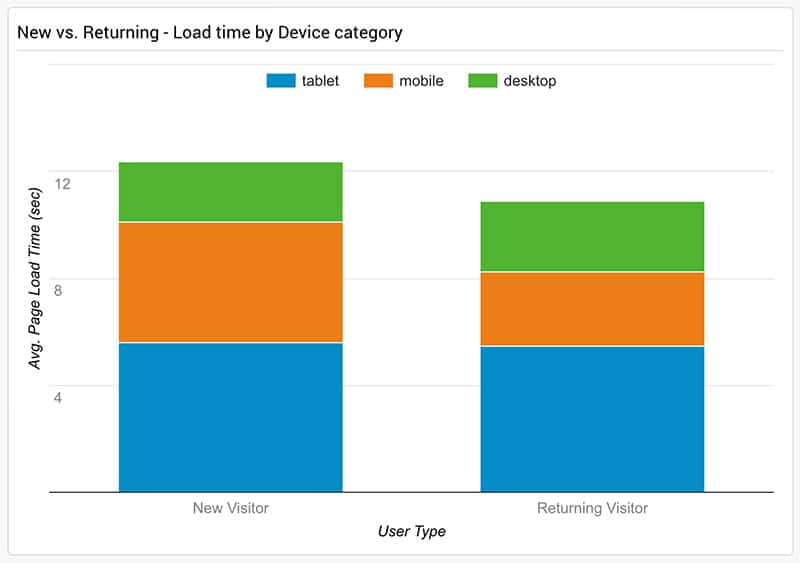
The New vs. Returning separation is useful for websites that are using cache engines (particularly browser cache).
The device categories have a very clear utility by offering details about speed on mobile, tablet or desktop.
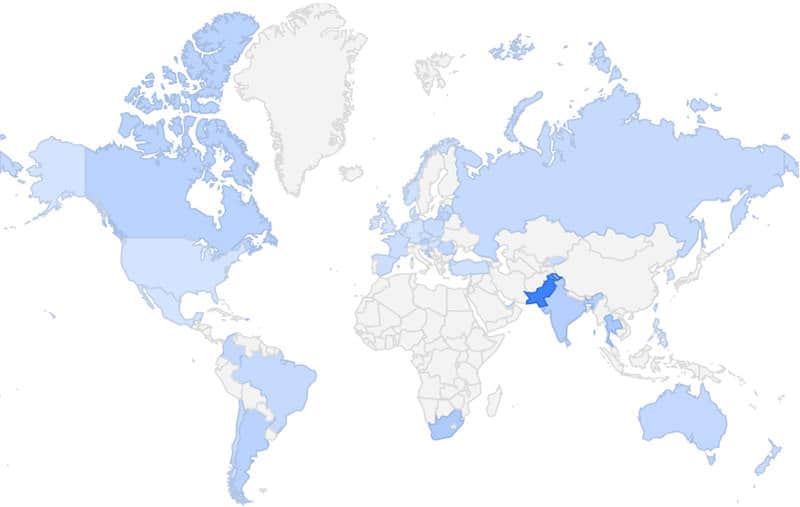
Loading time by country
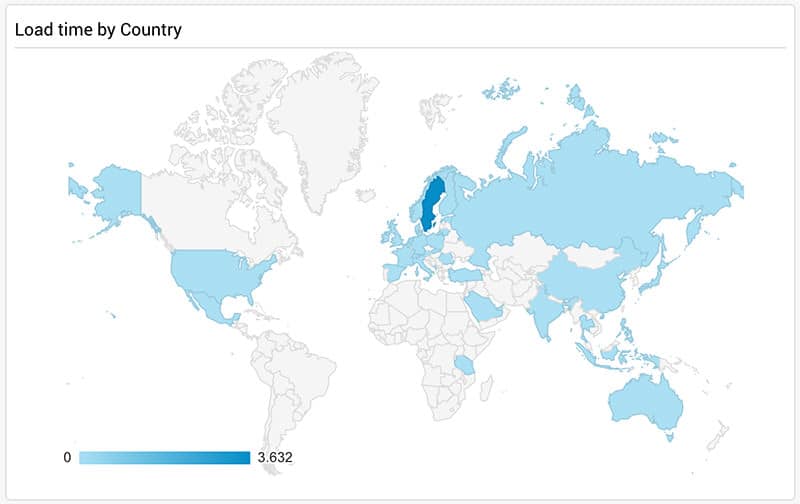
To narrow down this chart, you can edit it to replace the world with a continent or sub-continent.
Also, you can set it to show the regions or the cities from the country of your choosing.
Slow browsers by operating system
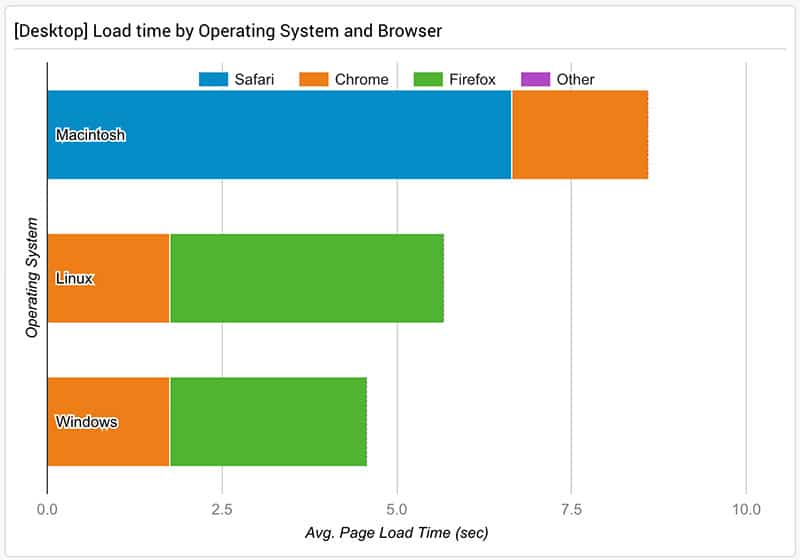
Very useful for spotting speed issues with specific desktop browsers.
Mobile devices loading time (Apple vs. Samsung vs. Others)
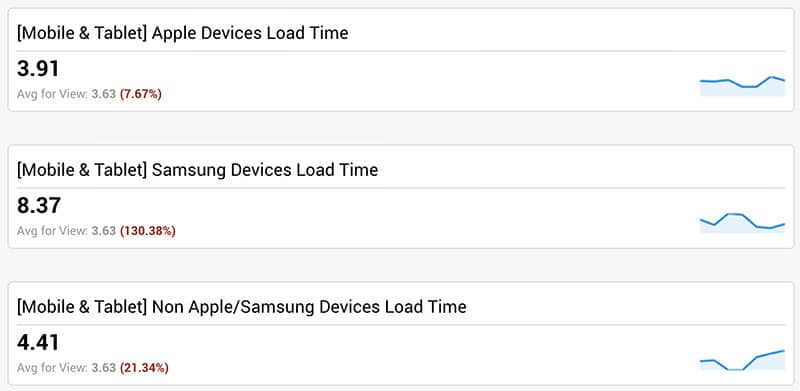
These three show average loading times for mobile devices by branding.
Load time vs conversion speed
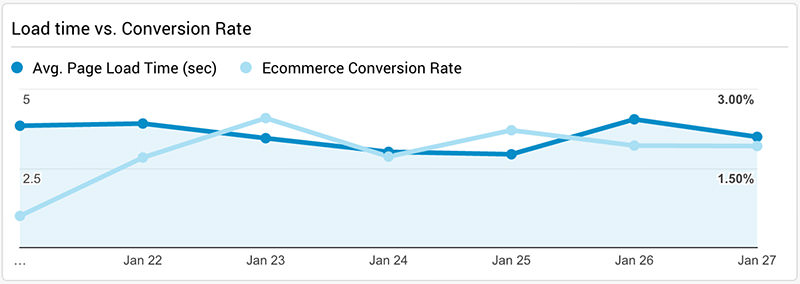
Want to see if and how loading speed impacts your conversion rate? Here is your chance.
Since the dashboard is called “eCommerce Speed”, in this chart, we are using the Ecommerce Conversion Rate.
But the widget can be adapted to use any conversion rate, for any of your goals.
Traffic vs load time
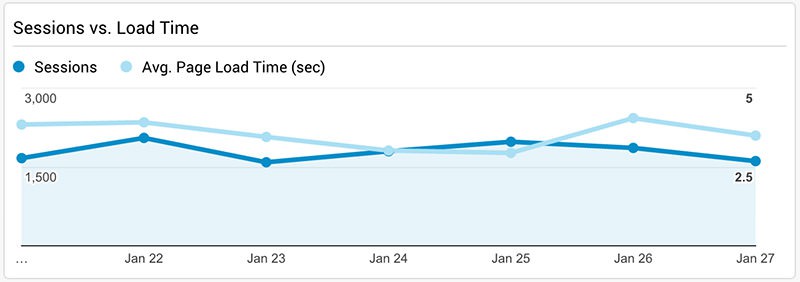
Want to see how the speed correlates with traffic spikes? This is the place to look.
Could speed impact traffic growth? This one is less likely, but it could happen.
Edit the widget to filter the traffic data by source, medium, campaign, etc.
Content drilldown speed
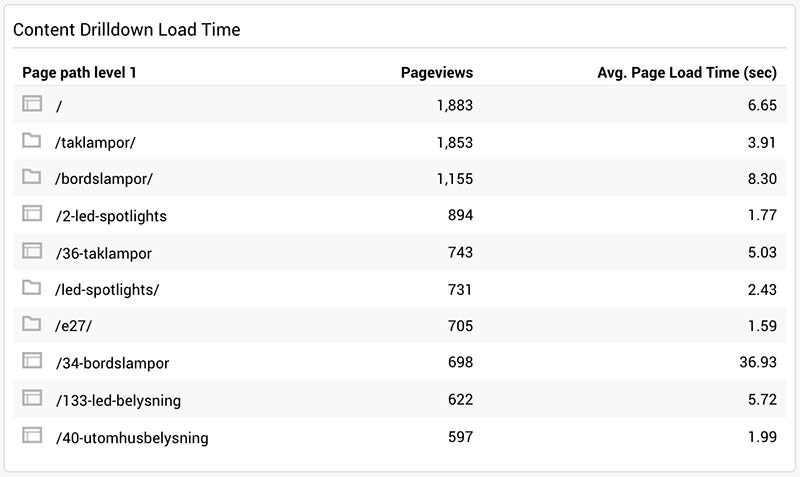
The content drill down report is an excellent way to look at aggregated data by sub-folder. Excellent for picking up speed issues for distinct areas of the site.
Get the Google Analytics Dashboard – 100% Free
Data Studio Speed Dashboard
Here is the overview
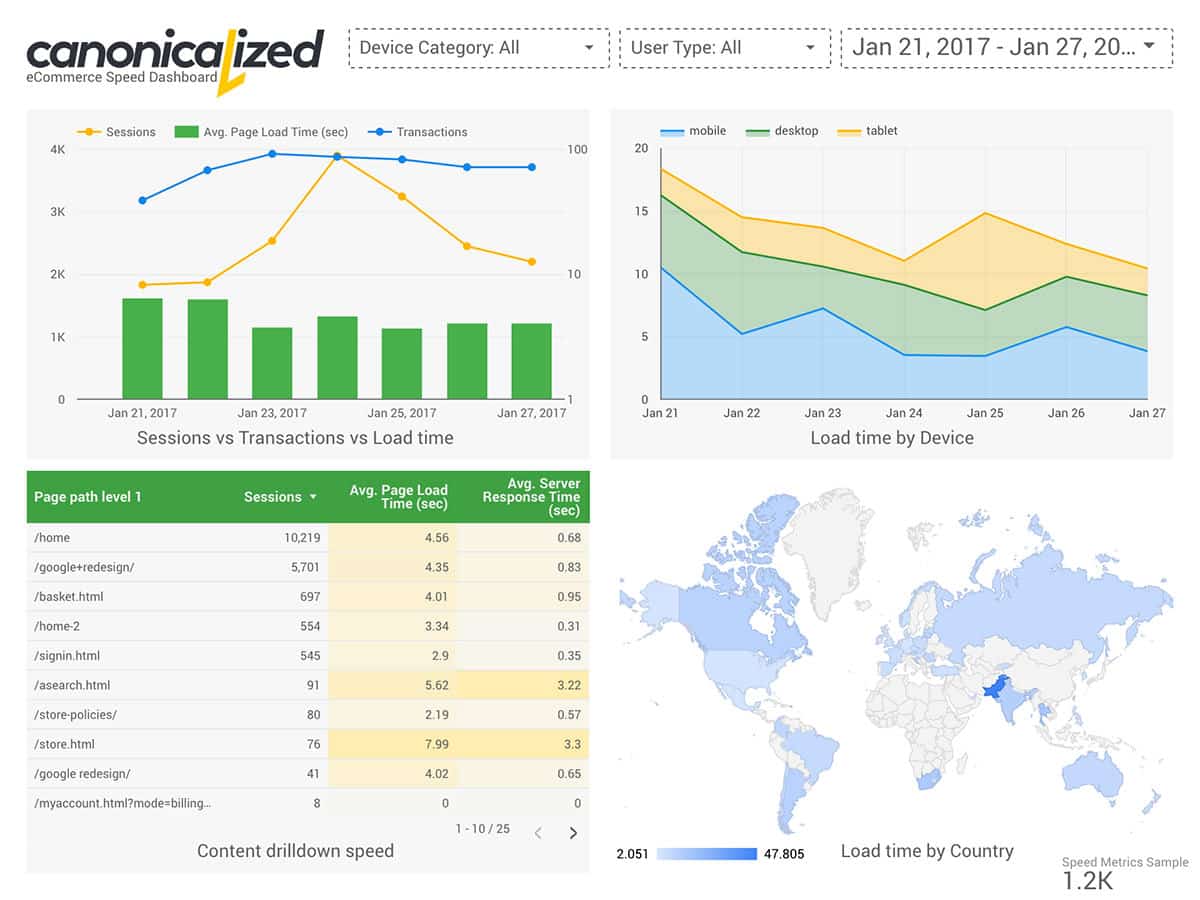
Data Studio, aside from being a new, excellent product, offers a quicker way to add/remove segments.
In our dashboard, we are using New vs. Returning users and Device Categories.
Let’s look at each graph
Sessions vs. Transactions vs. Load time
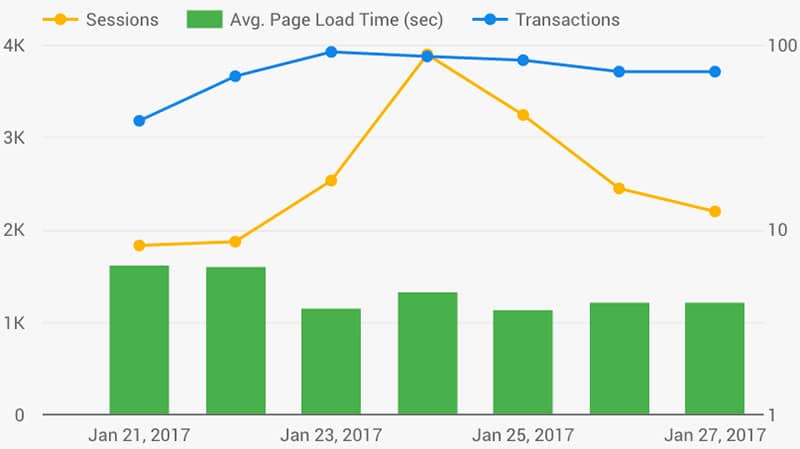
A magnificent way to watch how loading speed could influence conversions.
We also pull traffic volume, to add more context to the data.
Load time by device category
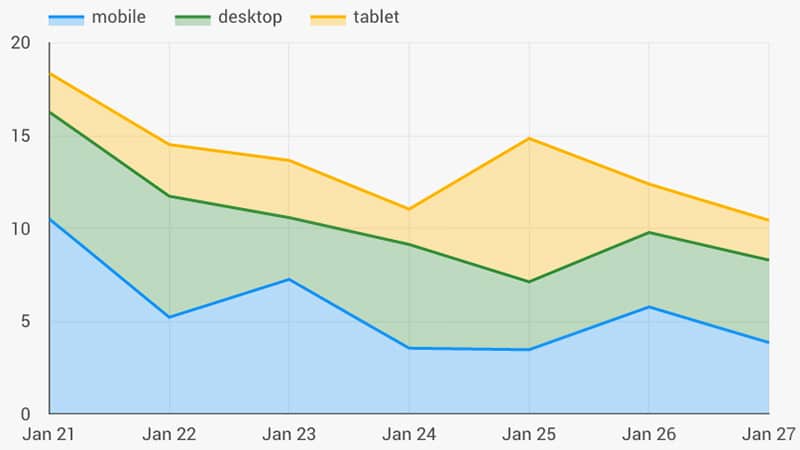
Keeping in touch with the speed of the three device types on a per day basis.
To look only at one or two categories, you can use the User Type Switcher from the header of the dashboard.
Load time by content drilldown
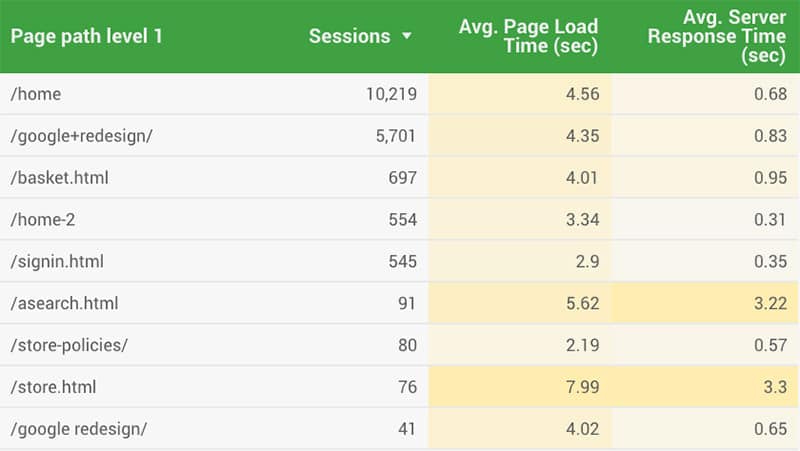
We love the content drill down report because it is remarkably useful for large and partitioned websites. In this table, we get an overview of the slowest areas of the site.
We also added the Average server response time metric for a more detailed speed insight and traffic volume for more context.
You can quickly sort the Data Studio tables can by any column. It can be super powerful in providing useful data.
Load time by Country
The geo report is similar to the one from the Google Analytics Dashboard. Like that one, you can set it up to show a particular sub-continent or country.
Could shine some light on why some geographic areas might under/over perform.
Get the Data Studio dashboard – 100% Free
Video Walkthrough: Setup and quick overview
Conclusion
Everything in this world is context, so let’s be smart about it.
Use segments like there’s no tomorrow! Go to town on all the metrics and figure out the areas where you need to improve!
There is no one fix for everything; there is no browser or device or geographic area or site section like another.
If there is one thing to remember from this article: use the reports to figure out what you have to improve, and start hammering at it one by one by one!
Highly passionate about data, analysis, visualization, and everything that helps people make informed decisions.
I love what I do! I am working to improve speed in every aspect of my life and that of our clients.
I find comfort in helping people, so if you have a question, give me a shout!


thank you !
Hey there! Nice article 😀
The data studio is not working dashboard it’s not working