A rant about SEO depth
Everyone and I mean everyone, knows a bit about SEO. It’s free traffic, right? We have to learn how to do it!
After all, what’s the big deal?
We read an article, we watch a video, have a chat with a “knowledgeable” friend, and we get excited.
We start thinking: We will do some stuff that will propel us to the moon!
We get that! We really do!
Well, the thing is that most of us do stuff without looking at the data. Why should we go through that torture, since it seems to be working for X?
There are so many stats to the point they become mind-boggling!
After all, what’s the point of going deep when we can just go through a step-by-step guide?
A month later we are right back where we started. Maybe a bit more distressed.
There is hope in the world!
If you’re reading this article, you are on the right path. If you reached the step where you want to look at the access logs for SEO insight, you’ve come a long way.
We want to congratulate you on that!
But enough ranting for now. Let’s get down to crawling business!
Crawlers & Googlebot
Crawlers are dumb! There, we said it.
People give them too much credit. We have this idea that a crawler is a mystical creature that always knows what trails to follow.
If we would treat them as the naive robots that they are, we might get ourselves an advantage.
Here are some assumptions we hear from time to time:
We deleted a section of the website; Google should know it’s gone and move on.
The more knowledgeable could say: “we put it 301 redirects”.
What they don’t tell you is that they redirect everything to the homepage 🙂 Check the destination of the redirects!
We’ll just block this section of the website from robots.txt, and everything will be ok!
We changed our URL structure and updated the sitemap, everything should be ok!
I did a website redesign, and my traffic dropped.
This is one of the saddest cases because there could be multiple reasons why a migration goes bad (log analysis could prove handy in this case).
This section is only for internal use, Google shouldn’t index it.
The test site got indexed.
This is one of our personal favorites. Since every website has a development server, it happens very often that people forget to block search engines from crawling it
The list could go on and on.
These are the type of theories everyone should stay away from!
Funny enough, we always seem to go back to the same kind of practices. I guess it’s easier to make assumptions than to test a theory.
Access logs have always been the go-to place for error debugging. As SEOs, analyzing them gives us a way of figuring out bots behavior on our site.
Google “Crawl Budget”
As we can see in this statement from Google, there’s pretty much no such thing as a Crawl Budget.
Shocking, right? Not really!
In fact, there are two factors Google uses: Crawl rate limit and Crawl demand.
Crawl rate limit – mostly dependent on your site’s speed/server resources. Google tries to figure out how much it can crawl without impacting the overall performance of the website.
Crawl demand – it depends on the popularity of the webpage and how often it’s updated with new content.
Is it important to remember this technical babble? Only if we want to know how to pave the way for crawlers 🙂
Search Console Data
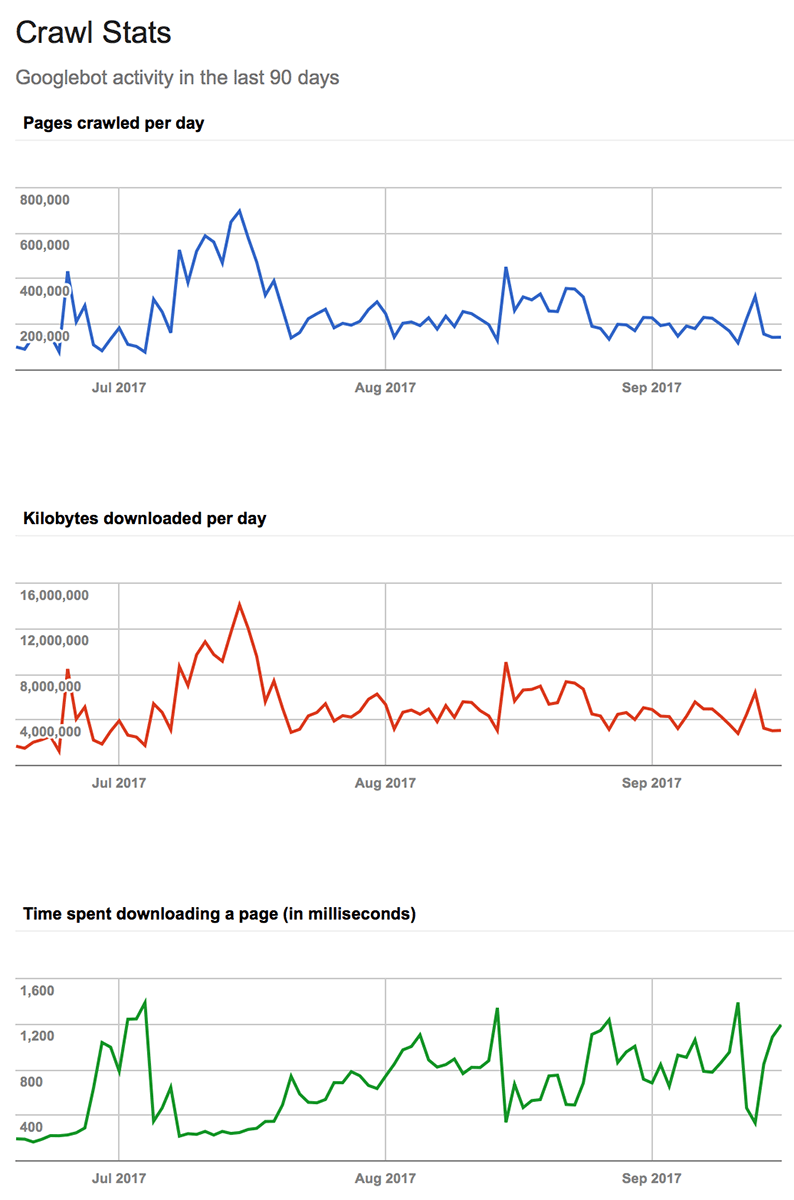
Google provides a report on crawler activity inside Search Console.
Why it’s not very relevant? Short answer: URLs can and will be crawled multiple times.
We should be looking for a chart like this one (alternatively, you can use a bar chart):
Now, this is more like it!
Setting up for the Analysis
Now that we’ve got the initial ideas out of the way let’s start setting up for our analysis!
The ustensils
In this article, we will be using free tools like R Studio and Tableau to process and visualize the crawl behavior.
Why? Because both are extremely powerful!
And you don’t always have to pay good money for log analyzer tools or services.
Also, you don’t need development knowledge to set up an Elastic-Logstash-Kibana environment. Here’s a guide on the ELK stack in case you want to test your geeky strengths.
If you’re into data analysis, here comes cookie time for you!
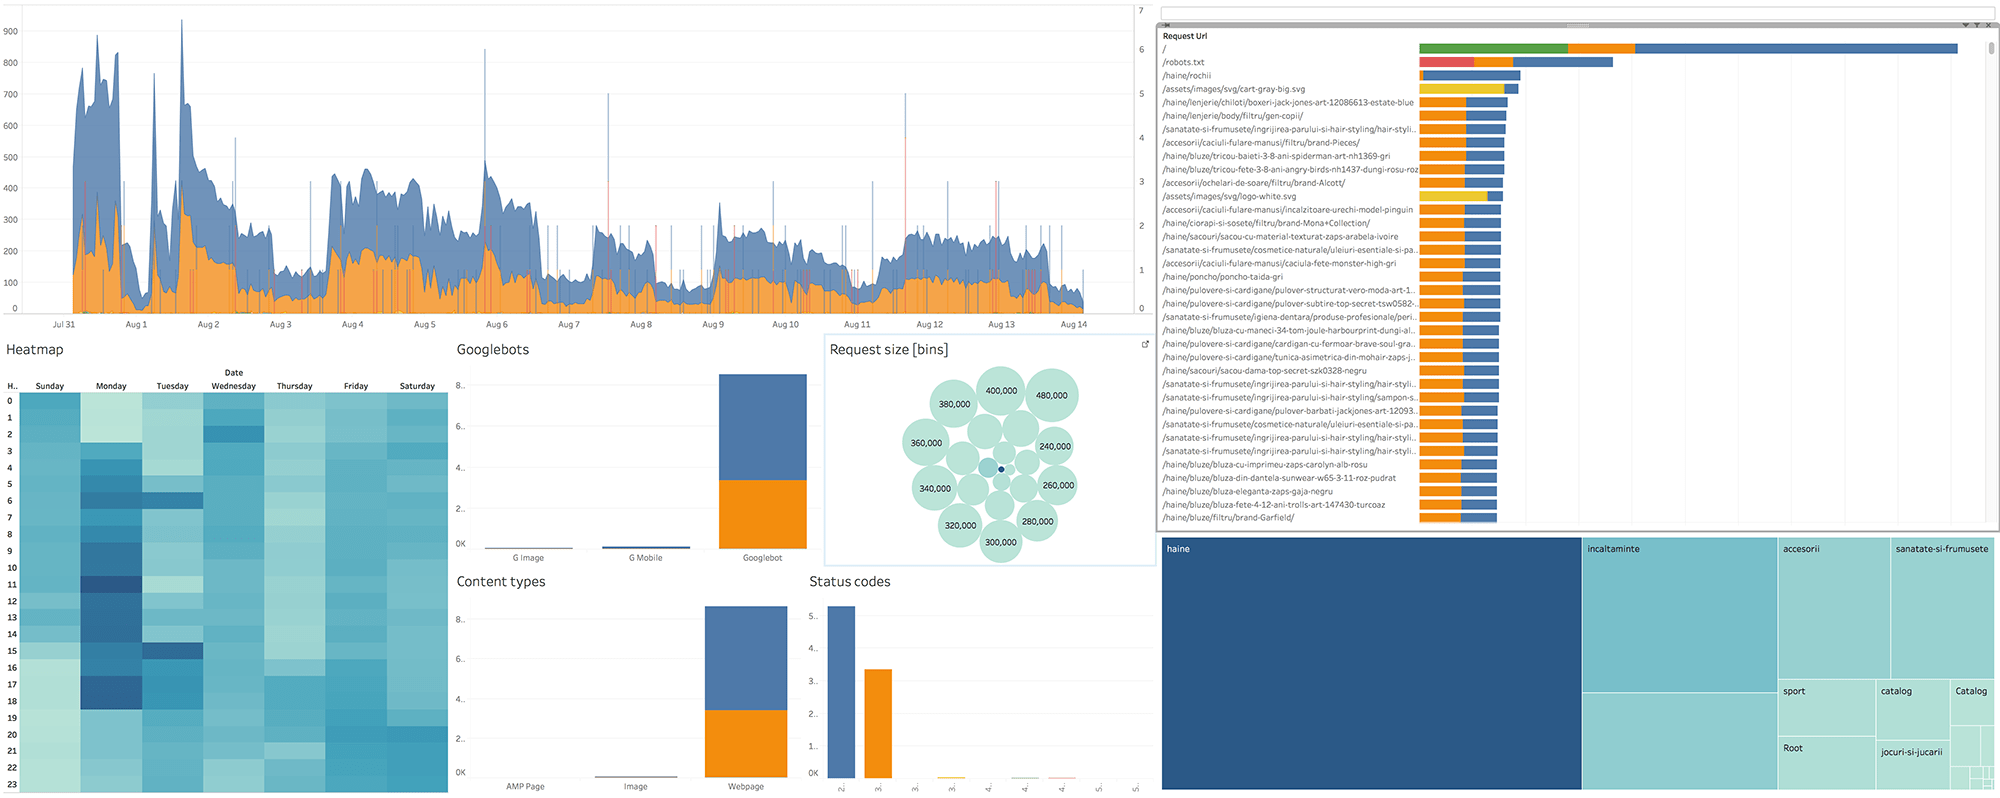
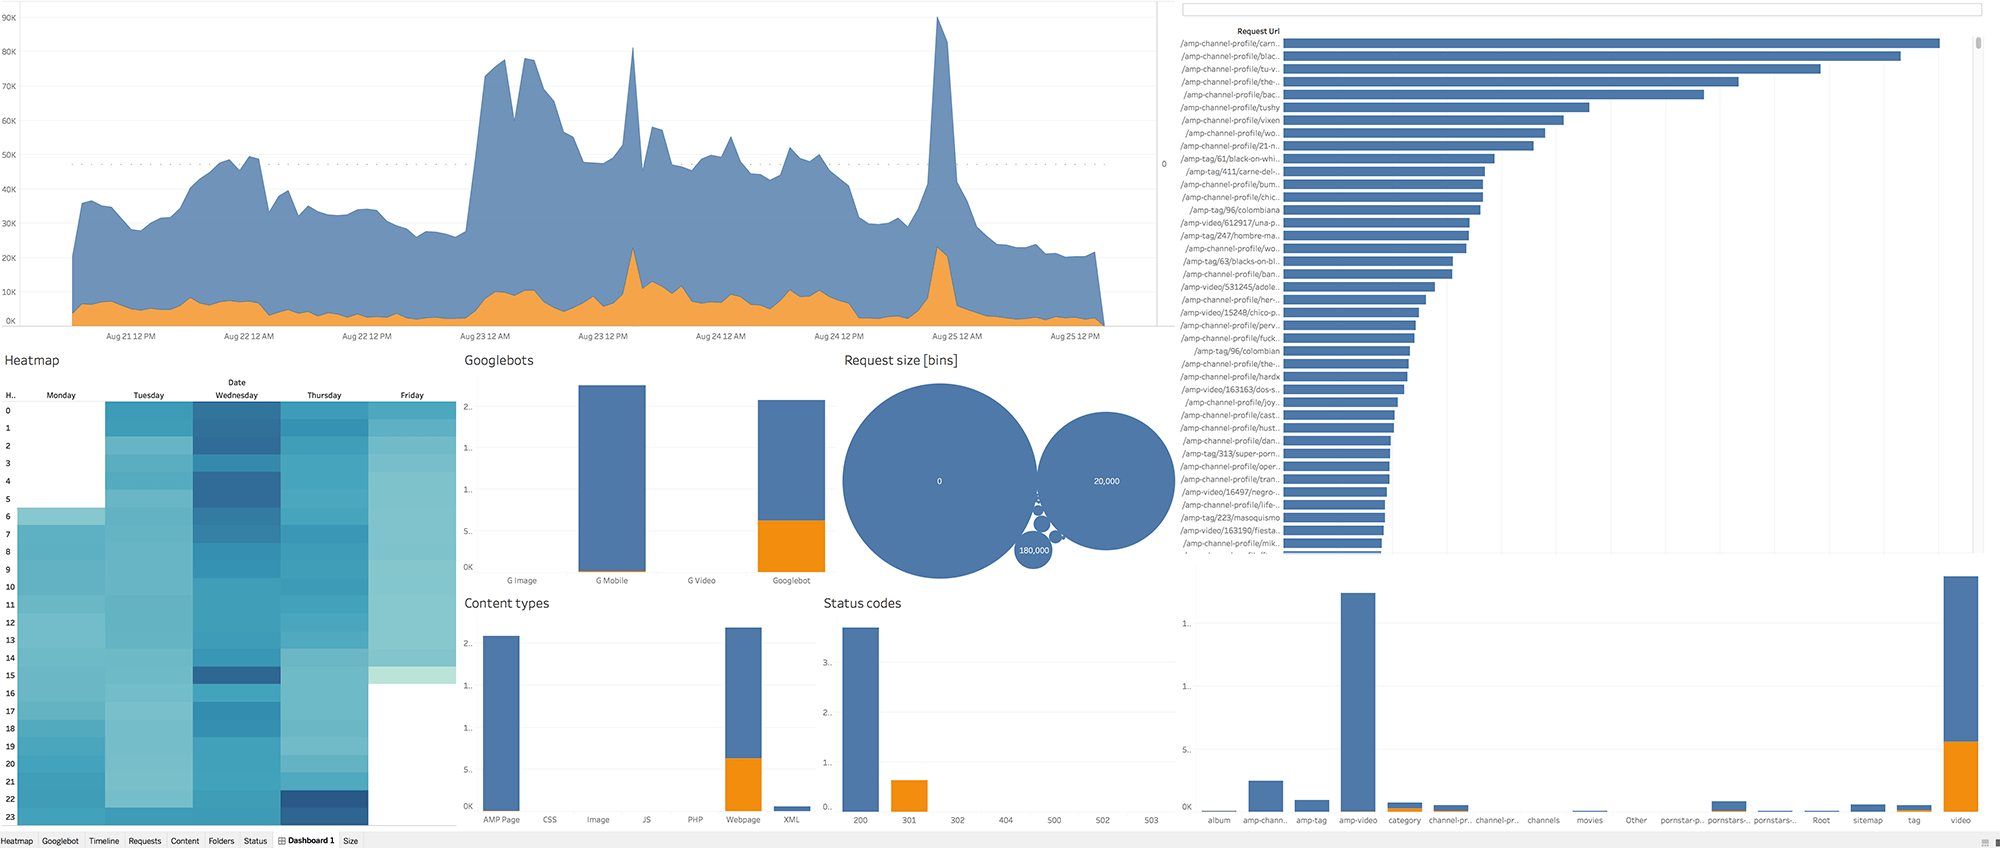
To give you a peak of the outcome, we are looking to build something that looks a little bit like this:
And here’s a link to a live example dashboard for you to play around with. We suggest going full screen, and maybe use a bigger monitor to get the complete picture.
What are access logs and where can we find them
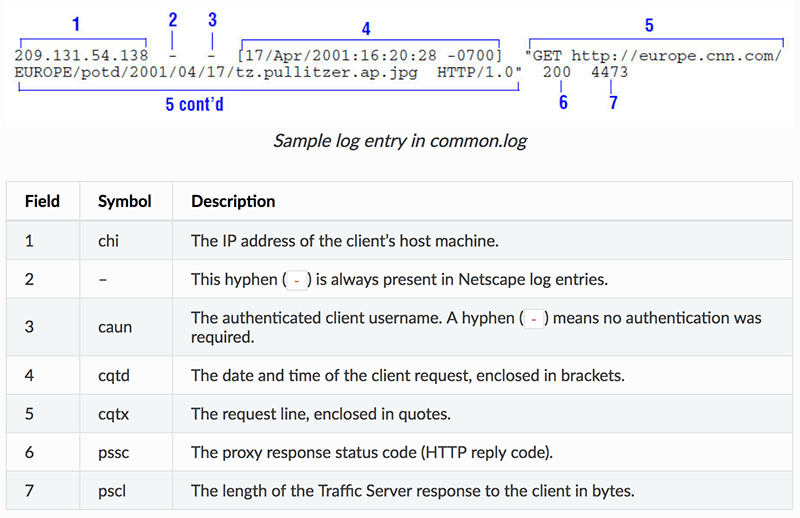
Access logs are files that contain records of all the requests that occur on the website.
One of the most common formats:
Not so good looking, right?! We’ll make it pretty as we go along 🙂
Be aware that some servers don’t have them activated because of “performance” issues. You would have to enable them and wait a few days to gather data.
You can usually find them in any Control Panel type of interface, or in a particular directory on the server. If you can’t spot them quickly, try asking for help from your host/sysadmin.
Start the processing
After we get our hands on them, we could face some difficulties.
Usually, there will be multiple files to deal with (http and https logs, daily/monthly logs, etc.).
We want to group them together and extract only the data we’re interested in.
Throughout this article, we will look only at Googlebot. We feel it’s the one we should focus our analysis on. If you want to look at other crawlers like Bing, Yandex, etc. make sure you change the grep command below to extract the data for your preferred bot.
If you are on a Unix machine, here’s the command to extract the Googlebot stats from all the log files (assuming you have all of them under the same parent folder)
grep -r "Googlebot" /path/to/logs-dir > /different-path/googlebot.log[Important] Make sure that you save the final log file in a different folder (not in your actual logs directory)! Otherwise, you might end up in an infinite loop and with a full disk!
This is a quick and easy way to it using the command line of your computer.
If you are on Windows, here are some ways to do it (via StackOverflow).
So now we have all the Googlebot stats under one file. The next step is to process the data in a way that it’s easy to plot.
Preparing the data
Most people would argue that this is the most significant step in data analysis.
We completely agree!
There will be no cool graph if the data isn’t organized properly.
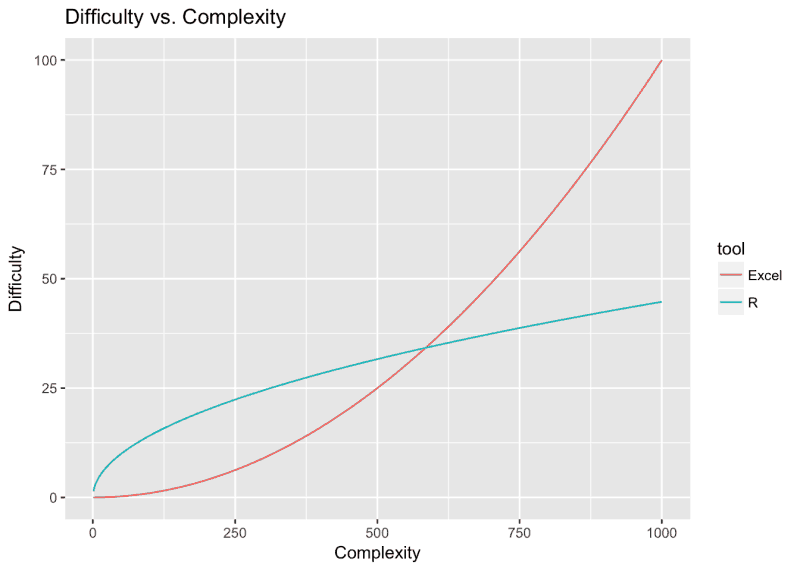
We chose R to manipulate the data because it gives us a lot of flexibility. We won’t say it’s easier to use than Excel, but it will process substantial amounts of data faster.
Not trying to scare you with R, or to coerce you into learning a new programming language. Again, you can prepare the data in Excel, here are just a few reasons why R might be considered better.
Also, here is a chart to keep in mind when thinking about R vs. Excel:
If it sounds exciting for you too, we present you with a short intro on how to transition from Excel to R.
Working with our log
Log files tend to pack a lot of information. If yours don’t exceed one million rows and you own a medium or high-performance computer, Excel would be an option for the processing. If not you should use a more powerful processing software or you could sample the data.
Below is our R code for processing Apache logs. It’s not spectacular, but it’s clean and straightforward.
We are reading a simple log file and turning it into a CSV adapted to our visualization needs.
Log configurations are usually variations of the same thing. In most cases, you only have to change the order of the columns for different formats (see the first comment in the code).
library(stringr)
library(tidyr)
raw <- read.table("/path/to/dir/googlebot.log")
df <- raw
#the common combined log columns -> add/remove/switch columns depending on the format of your log
colnames(df)=c("host","ident","authuser","date","time_zone","request","status","bytes","referrer","user_agent")
df <- df[str_detect(tolower(df$user_agent), 'googlebot'),]
#extract the date&time in a common format
df$date=as.POSIXct(strptime(df$date, format = "[%d/%b/%Y:%H:%M:%S"), format="%Y-%m-%d %H:%M:%S")
df$time_zone <- as.factor(sub("\\]", "", df$time_zone))
df$bytes <- as.factor(sub("-", "0", df$bytes))
df <- separate(df,request,c("request_type","request_url","http_header")," ")
#drop POST calls -> keep them if you think they might be useful for the analysis
df <- df[!str_detect(tolower(df$request_type), 'post'),]
##optional - drop unwanted/useless columns -> keep them
#df <- df[,!(names(df) %in% c("request_type","http_header"))]
#extract the googlebot type
df$googlebot <- as.character(df$user_agent)
df$googlebot[str_detect(tolower(df$googlebot), 'googlebot-image')] <- "G Image"
df$googlebot[str_detect(tolower(df$googlebot), 'mobile')] <- "G Mobile"
df$googlebot[str_detect(tolower(df$googlebot), 'video')] <- "G Video"
df$googlebot[str_detect(tolower(df$googlebot), 'googlebot')] <- "Googlebot"
#extract resource type
df$content_type <- as.character(df$request_url)
df$content_type[str_detect(tolower(df$content_type), '\\.js')] <- "JS"
df$content_type[str_detect(tolower(df$content_type), '\\.css')] <- "CSS"
df$content_type[str_detect(tolower(df$content_type), '\\.jpg$|\\.png$|\\.jpeg$|\\.gif$|\\.svg$|\\.ico|\\.webp$')] <- "Image"
df$content_type[str_detect(tolower(df$content_type), '\\.woff|\\.woff2$|\\.ttf$|\\.ttc$|\\.otf$|\\.eot$')] <- "Font"
#change the following rule to select your URL structure for AMP pages (/amp-, /amp/$, ?amp|&, etc.)
df$content_type[str_detect(tolower(df$content_type), '\\/amp-')] <- "AMP Page"
df$content_type[str_detect(tolower(df$content_type), '\\.xml$')] <- "XML"
df$content_type[str_detect(tolower(df$content_type), '\\.php$')] <- "PHP"
df$content_type[str_detect(tolower(df$content_type), '\\/')] <- "Webpage"
#get root folders
df$folder <- df$request_url
df$folder[str_count(df$folder, "/")<=1] <- "/Root"
df$folder <- sapply(strsplit(as.character(df$folder), split="/"), function(x) { length(x) <- 3; x[2] })
##Folders with less than 0.01% of crawls -> group them into Other
library(plyr)
counter <- count(df$folder)
minimum_crawls <- max(0.01/100*length(df$date),10)
df$folder[df$folder %in% counter$x[counter$freq < minimum_crawls]] <- "Other"
#extract the robots file crawls
df$robots_txt <- as.character(df$date)
df$robots_txt[!str_detect(tolower(df$request_url), 'robots.txt$')] <- ""
#write the processed data to a CSV file
write.csv(df,file = "/path/to/dir/processed_log.csv")We are using only three libraries to process the stats: stringr, tidyr and plyr.
Sampling the data
More is not always better. Sometimes it makes more sense to use only a fraction of the data.
The main advantage would be the speed improvement of processing the data and interacting with the dashboard.
Sampling makes a lot of sense when looking at the bot behavior. If you are trying to pinpoint errors, you are better off looking at the whole dataset.
When is there enough data?
Quick tip: Do it before processing the log to speed up the process.
Here is the command we are using on a Linux machine:
cat largelog.log | shuf | head -n300000 > lightlog.csv*[Mac users] use gshuf instead of shuf (install coreutils if you don't have them)
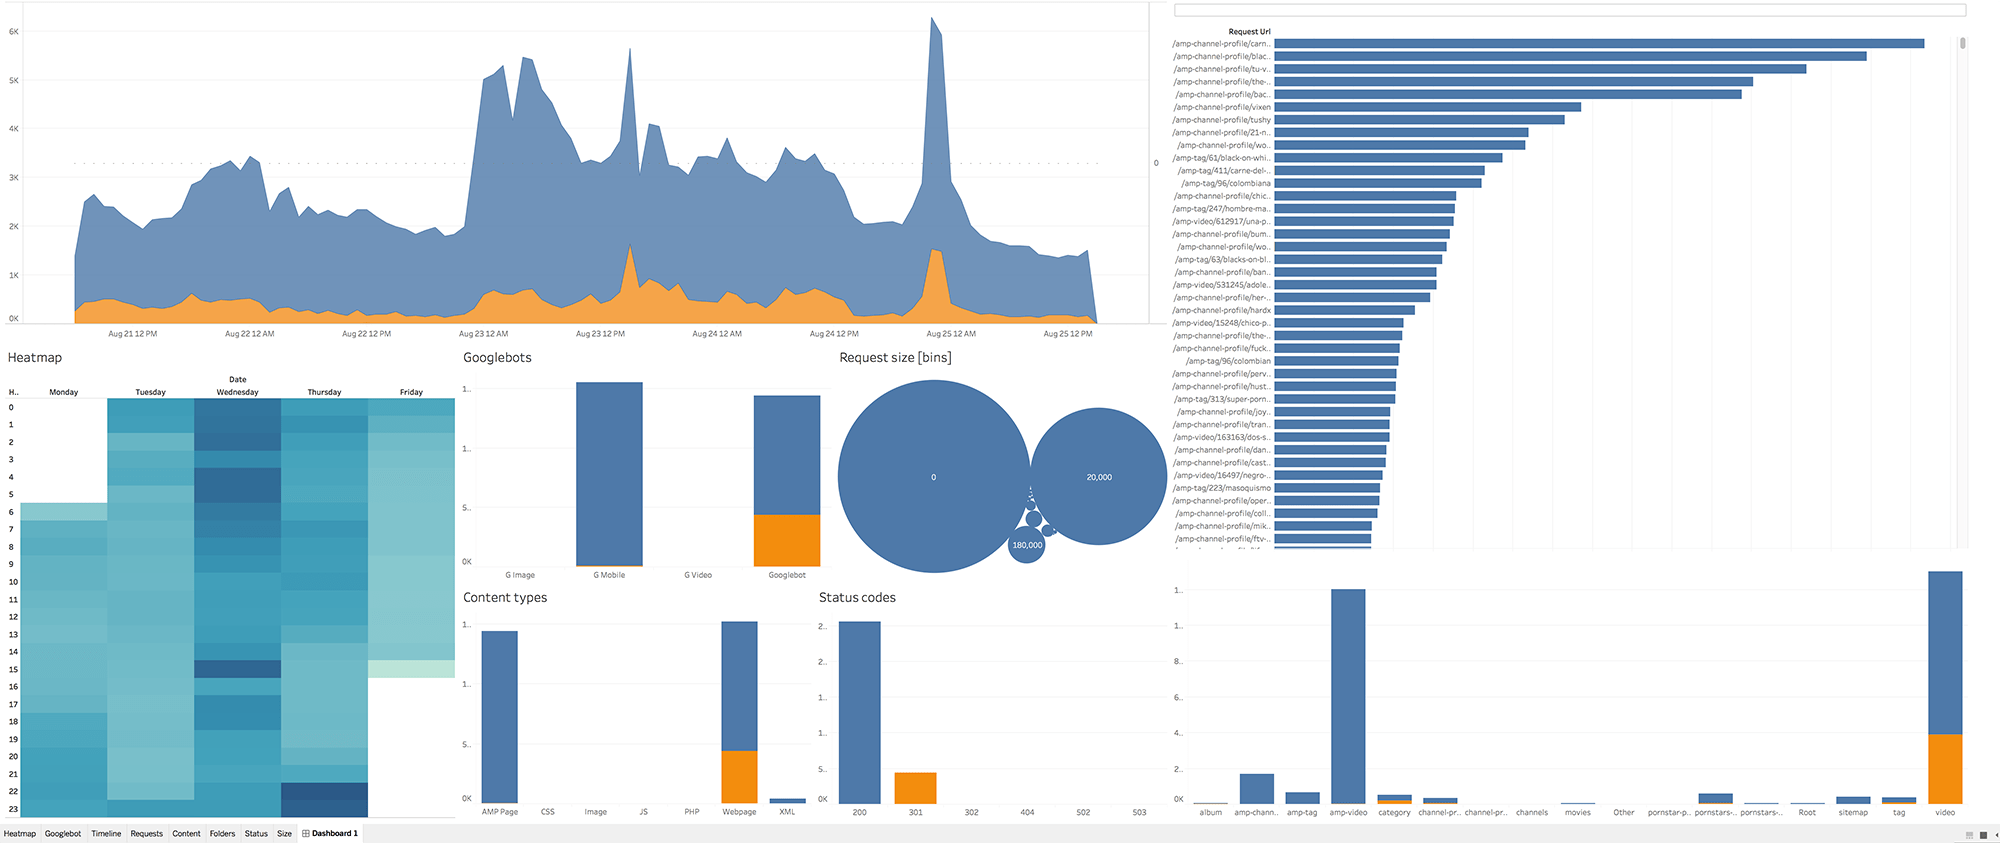
We sampled down from a log with 4.5 million rows to 300.000 rows. The patterns are almost identical as you can see below:
Non-Sampled
Sampled
Quite similar, right? Almost magical!
Mindset 1: Crawl Analysis
At this point, we could do the data visualization in R as well.
We are going to use Tableau because it offers a lot of interactivity, especially with the dashboard functionality. It's highly dynamic, and the charts are interconnected.
We suggest using Tableau Reader for the exploratory analysis after you do the set up in Tableau Public/Desktop/etc. It's a bit faster!
There are two parts/benefits to the analysis process: hunting for errors and literally looking at crawling patterns. Each of these requires a different mindset.
Hang on tight to see how easy it can be to explore the data!
Crawl timeline
It's useful to have a time series that we can break down by root folder, status, page type, requests, etc.
Also, we can filter down by one or more specific URLs. This way we can look at the bot activity for particular parts of the website within a few clicks.
Juicy!
Specific dates/hours
Since we have precise dates for every hit, we can play around with the timeline's granularity.
We can look at bots activity by seconds, minutes, hours, going up to weeks, months, quarters or even years.
There are three simple steps to look at the data in a specific timeframe:
- select the period using your mouse (point-click-drag)
- right click on the selection
- select "Keep only"
The video below exemplifies how you can change Date types and select specific timeframes:
Possible downtimes
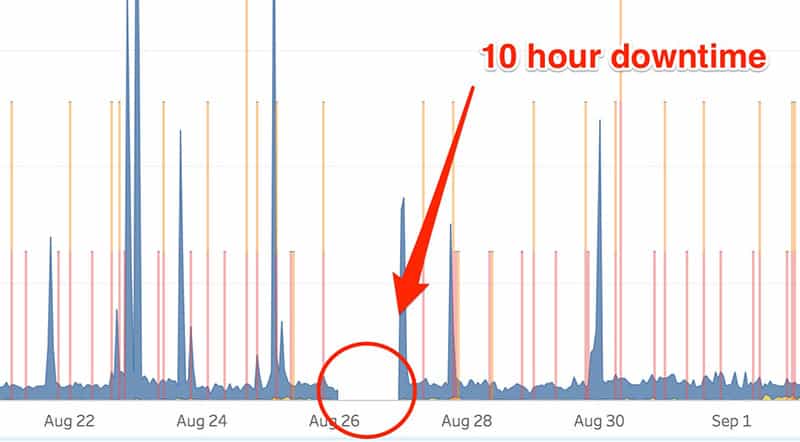
The timeline makes it very easy to spot a downtime as you can see below.
And with the following screenshot in mind, we can bust the myth stating that Google won't crawl your website as much after you've had a downtime.
Another delightful insight!
The Heatmap
Looking at the timeline in combination with the heatmap we can then recognize daily, and hourly patterns in crawling.
These pop into mind right away:
- crawling during weekends
- weekly patterns
- night-time vs. day-time activity
Further analyzing the heatmap could also reveal the peak hours for bots activity.
With this information in our pocket we could start thinking about:
- checking/improving the server speed during those periods -> to avoid/increase the crawl rate limit
- adjust content updates/upgrades accordingly -> to avoid content staleness
The Treemap
Looking at the logs by root folder
We decided to use both color gradient and size to represent the number of hits.
If you feel it's overkill or if you want to use a different measure for the color (such as Response size) you can quickly change it by drag&drop.
Easy as that:
Root folders might not work for everyone because it's so dependent on your URL structure. But you can group the URLs by different patterns if you like.
Let's say that you want to group the URLs by page type (category, product, filters, etc.). We would change just a few lines in our R code to extract specific patterns from URLs.
Narrow down
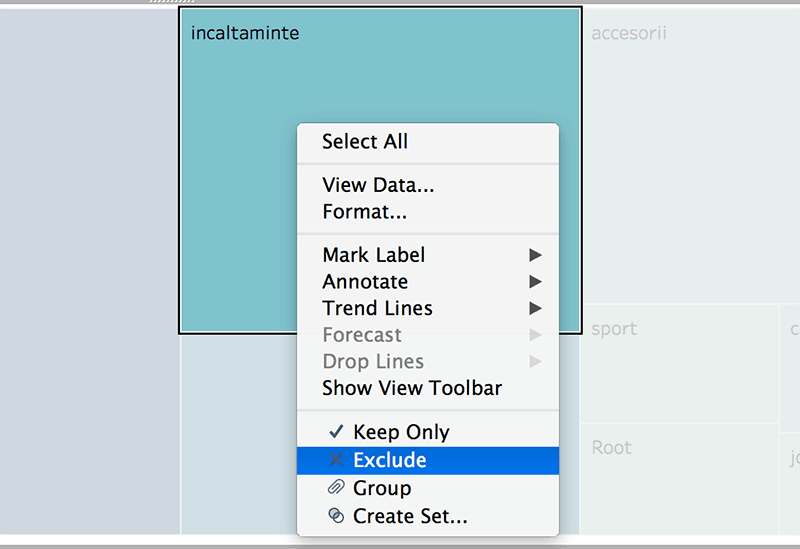
Are you done with one folder? Right-click and exclude.
It could help you focus your analysis since all the charts will respond to the removal filter!
Robots.txt
Not to be confused with the robots meta tag.
It is the pivotal file for any polite crawler. It's highly valuable since it's used to block bots from accessing worthless parts of the website.
Let's take the following screenshot as an example:
Are you able to guess when we added the robots.txt file? I'm sure you can!
Can we spot a trend in organic traffic for this particular website?
Seems very likely!
Note that the vertical lines over the timeline represent the robots.txt hits colored by response code. We added them because most crawls usually start with a robots.txt fetch.
If the file becomes inaccessible at some point, the crawl process might stop.
Search console warning
If you don't have a robots.txt file in your root folder, the most common response code is 404.
In this case, Googlebot will still try to reach it regularly but will assume that everything is accessible on the website.
You will also be getting the following warning inside Search Console:
Type of crawler
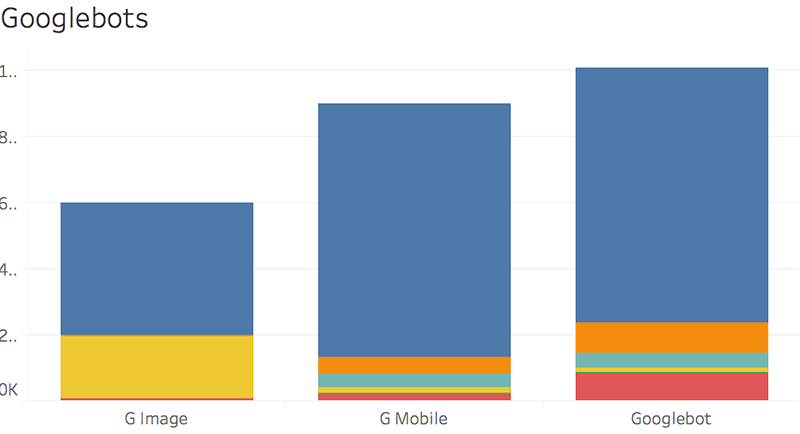
It's an excellent chart to compare mobile vs. desktop bot hits. It's also useful as a filter for the dashboard.
We grouped the Google bots like so:
- the main Googlebot
- the Mobile bot
- Googlebot Image
- Video
The cute colors represent response codes. We'll share more details about them a few paragraphs below.
Type of content
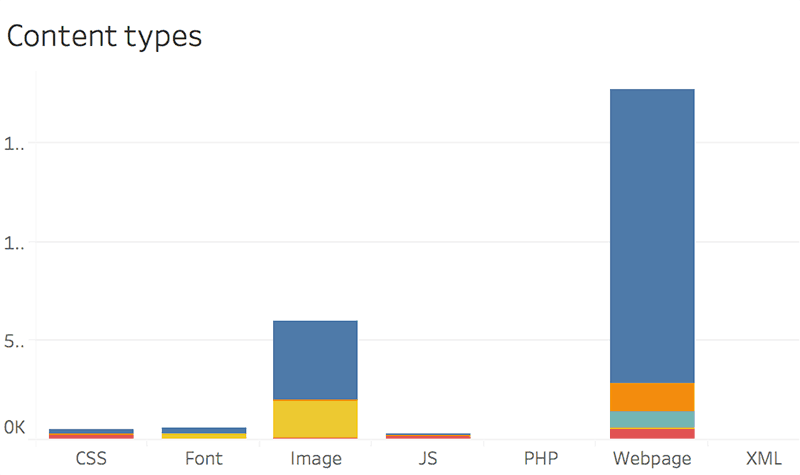
You probably know you shouldn't block bots access to Javascript and CSS files.
We would also include fonts, images and any other static files that might contribute to the visible part of the website.
Here is a chart example:
Special pages: AMP
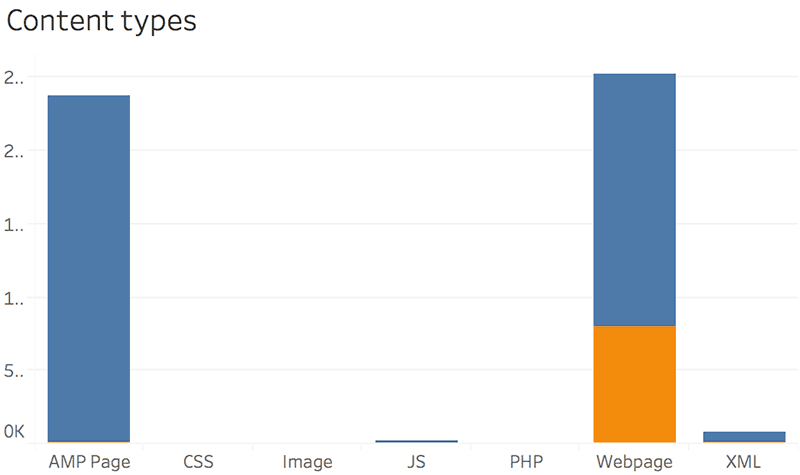
We included Accelerated Mobile Pages as a page type because we noticed some fascinating behaviors.
We assume Google likes to crawl AMPs since they are remarkably lightweight.
Compared to the heaviness of most responsive websites, rendering an Accelerated Mobile Page requires fewer resources.
Mindset 2: Debugging for errors
Error Response Codes
Almost any tool will show the requests that result in errors, though not all of them will offer the possibility to filter down in one click.
In our dashboard we have the opportunity to look at patterns over time by bot type, content type, by root folder, and so on.
The breakdown by folder is one of the most insightful reports if you are trying to isolate errors or to find what's causing them.
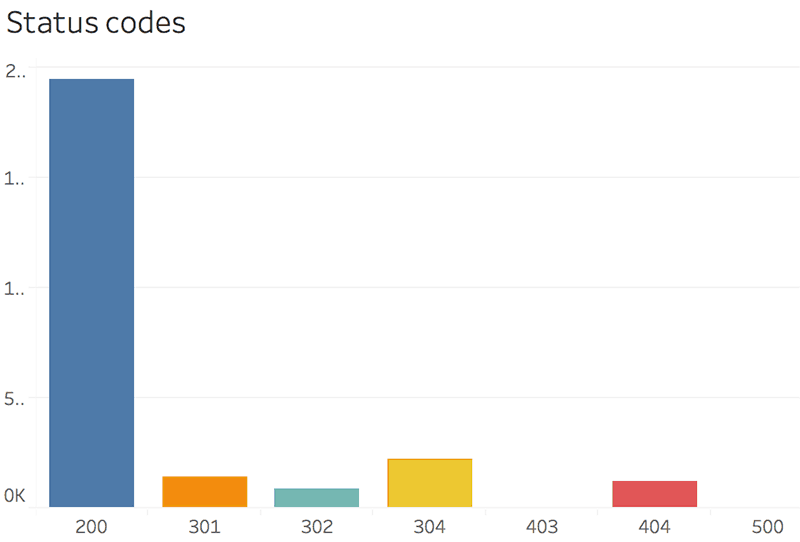
You can even color the treemap by response code to separate the response codes visually.
In just a few clicks:
Drag and drop the Status (response code) over the color and set it as a discrete dimension.
Let's have a look at some of the traditional errors!
400
403 Forbidden, 404 Not Found, 410 Gone, etc. These are the errors you have to watch out for the most.
We almost always recommend adding 301 redirects instead of leaving them behind for Googlebot to bump into.
If the URL existed at some point, Google would come back to see if anything changed for this address. If it responds with an error, you have to figure out what caused it.
If there is no chance to get the content back on the page, 301 redirects are your safest bet.
Yes, there is no way out of this! We have to go through the list of errors, set up destinations for each URL/set of URLs, and add the redirects on the site.
We can even use R/Excel to export or filter through the errors we are interested in.
Static files 404s: Yes CSS, JS, Images, Fonts can also cause 404s.
We mentioned that it's a good idea to classify the errors by content type. A lot of you might think that these are just images or Javascript, so it's not a big deal.
It's true, not a very big deal. But these are still errors that Googlebot will have to deal with.
500: server issues
We have to discover what's generating the errors (server, broken links, whatever) and fix the leaks.
For server errors we don't usually have to add redirects, just find ways to avoid them.
Special mention for 503s. Used primarily for websites that are in maintenance mode.
So don't get scared if you see them in your logs! In fact, this is how Google recommends dealing with scheduled downtimes.
Redirection response codes
We could use the similar techniques like the ones above to look at 301s by folder, content type, Googlebot type or by top crawled URLs.
Here are some statuses worth mentioning:
301
Permanent redirects are the most go-to approach when dealing with errors or deleted content.
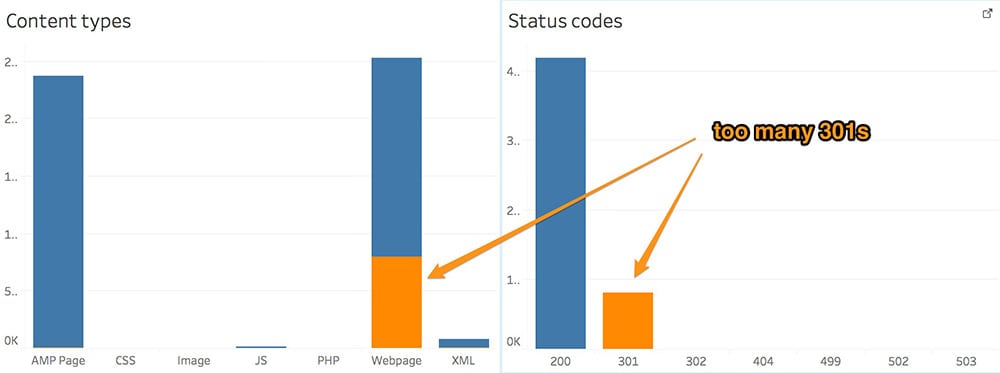
The log analysis could reveal redirects in places where we don't want them. A high percentage of redirects might be a sign that something is wrong.
For example, let's say we have some links to non-www URLs inside a website that redirects every non-www URL to their corresponding www version (http://www.yoursite.com [link]-> http://yoursite.com/page [redirect]-> http://www.yoursite.com/page).
This is precisely the kind of stuff you should avoid. Use the final URLs to sidestep unnecessary crawls!
Don't neglect the destinations!
One other thing that people often forget is to look at the target of the redirects.
Having a 301 response code is useless if the destination is a 404 page. Also, multiple redirects in a row (usually called redirect chains) are problematic.
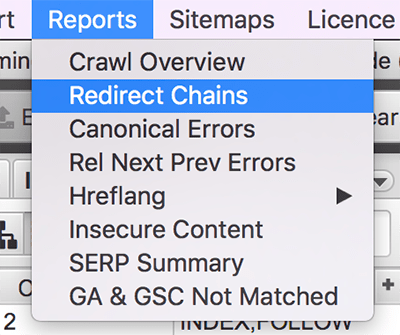
As a good practice, we recommend crawling all the redirects with a tool like ScreamingFrog.
Here you can export the redirect chains:
You can also copy all the redirect destinations and paste them back into the crawler. This way we check if all of them respond with a 200 status code. If not, we have to deal with the ones that don't.
302/307
Apparently, nowadays it doesn't matter very much which type of redirect we use.
You should always ask what is the reason behind temporary redirects.
Will the content re-appear on that specific URL? If not, we would recommend switching to a permanent one (301).
304
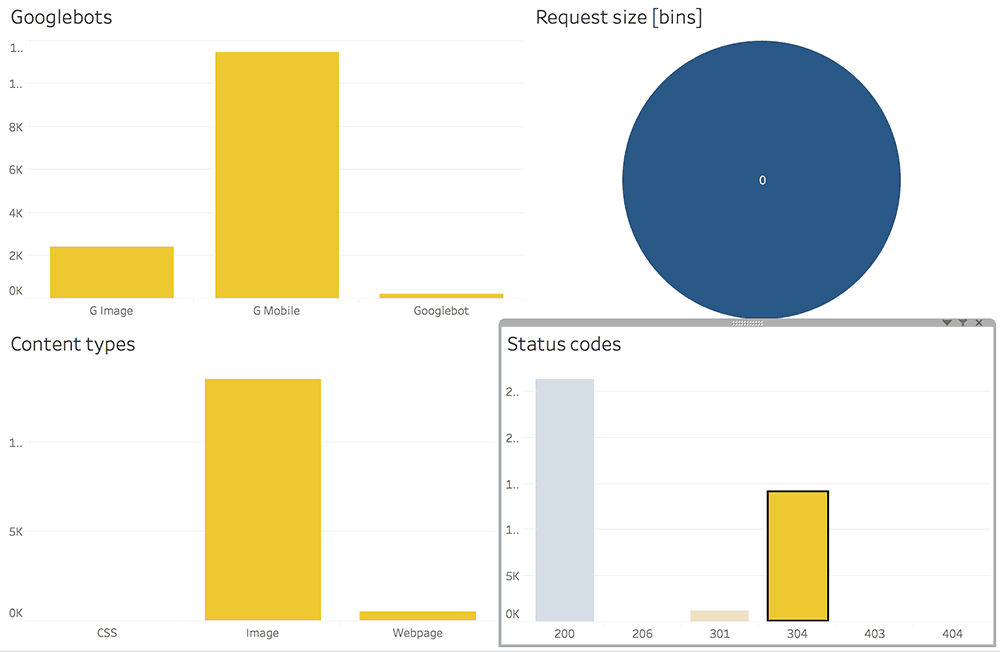
Don't worry if you see a lot of 304s! They are genuinely useful.
304s (Not Modified) are not actual redirects. They are just headers that tell bots that the content from that URL hasn't changed. Hence, no need to crawl it again.
Wow, this actually sounds beneficial!
The most common ways to set this up are Expires headers, Cache-Control or any of the ones listed here.
If at some point if you used PageSpeed Insights to check your speed scores you might have noticed the Leverage browser caching warning. 304s are the sweet result of fixing them.
It looks like 304s are very helpful for images or large static files like fonts.
In our dashboard, we could filter by static content types and look for URLs with no 304 response codes. These could indicate that no expiration dates are set.
Request size
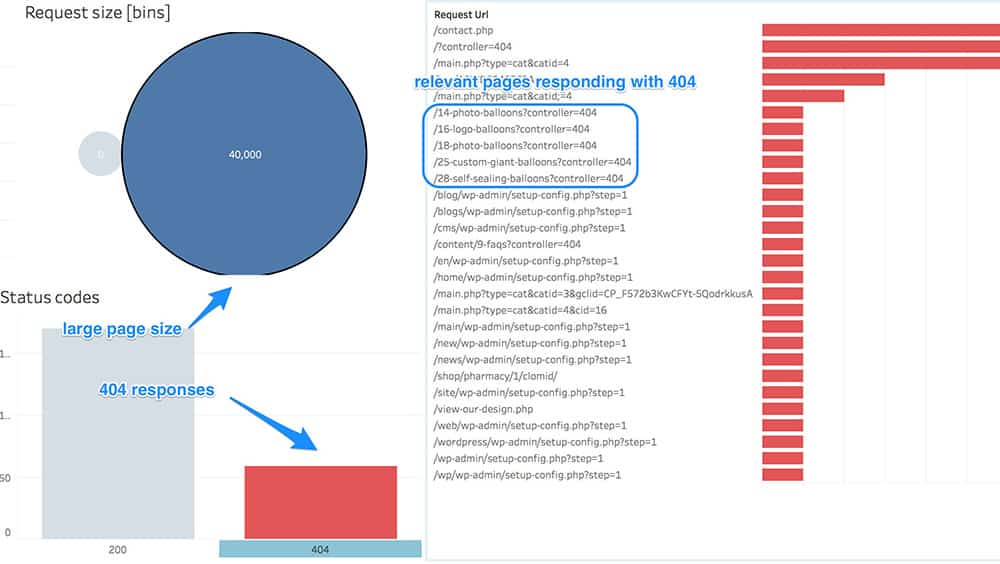
It's not substantially relevant in every case, but sometimes useful to spot thin content pages or abnormally large static files.
We created a field in Tableau that groups our URLs by size. Our advice is to play around with bin sizes until the report becomes relevant for your use case.
The X-files: weird findings that could surprise anyone
Redirects to "/-"
Makes you think about the destinations we talked about in the response codes section.
404s for working pages
In this particular case, we don't need redirects (since the page has actual content), we just have to fix the cause
Malicious URLs
Actions to clean up:
- check if the site is hacked (most likely it isn't; don't panic before you look into it!)
- disallow the folder from robots.txt
- disavow all the external links coming to the URLs from that particular folder
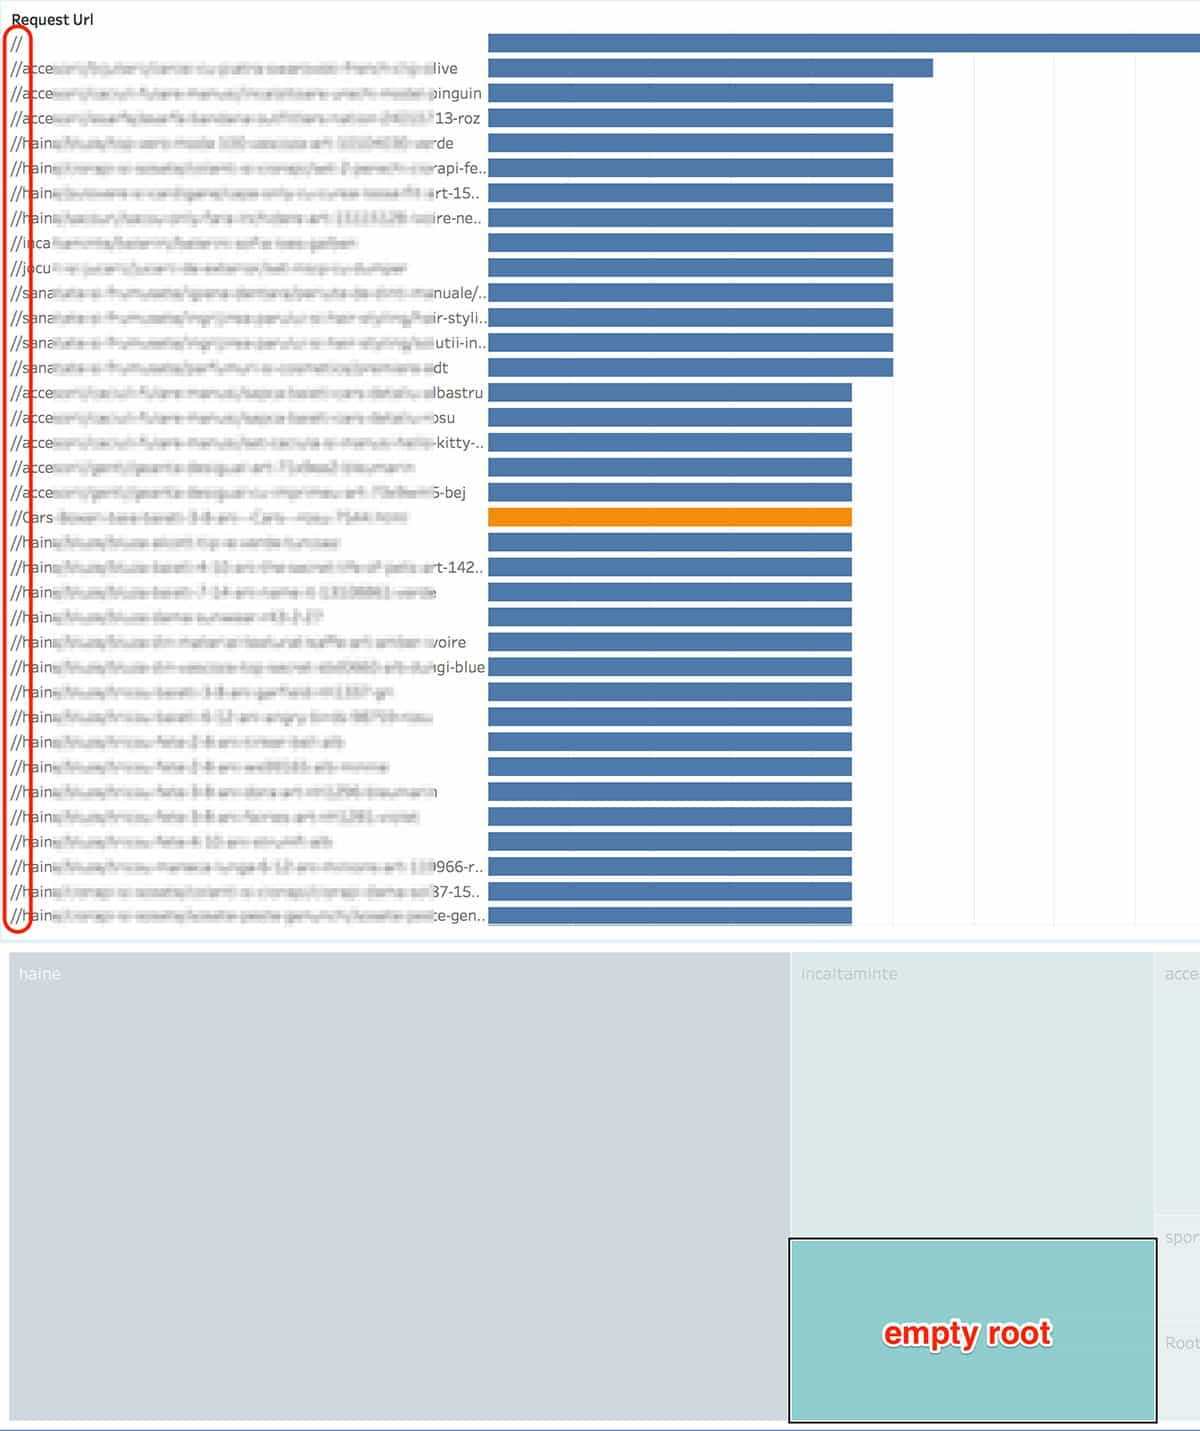
URLs starting with double-slash ("//")
This website was duplicating every URL because of a mistake in the canonical tag. We fixed the leak and redirected every URL to the one slash version "/".
… to be continued
Our commitment
This is not your everyday analysis. We feel how important the log analysis step is in today's world and we hope you are starting to taste it too!
But we are aware that not everybody has the to spend time on it. So we decided to give out our help for free!
We are willing to help you with the data preparation and the dashboard setup.
Why? Because we feel it's a too big of a piece to disregard!
Before you start asking what do we get out of it, what is our business model, etc., just don't.
We are happy to help! We don't know how much spare time we'll have in the future, but this is something we are doing now.
The confidentiality of the data is something we take very seriously. So if you have any concerns about it, talk to us, and we'll find ways to put your mind at ease.
All you have to do is to drop us a line using the live chat (right-bottom side) and send us your logs via file transfer! We'll be here!
Maybe this could fire up a desire to help in some of you as well! After all, life is all about helping each other.
If you want to do it on your own, the R code is above, and you can download our Tableau Workbook from here.
Highly passionate about data, analysis, visualization, and everything that helps people make informed decisions.
I love what I do! I am working to improve speed in every aspect of my life and that of our clients.
I find comfort in helping people, so if you have a question, give me a shout!
