Tableau Consulting Services & Analytics Support
We believe in the visual analytics future of the business world. If you landed here, you are probably somewhere along the same path.
To assist you in your journey, we are offering Tableau help and consulting services.
We are a Tableau Partner working to help people make the most out of the software and to answer the right questions with data.
Do you represent a charity, a non-profit organization or you just want to do good with data? We might be able to help you for free!
Contact us to see how we can help people together!
Why do you need Tableau consulting?
Accepting assistance is not a weakness! We genuinely believe that a good leader knows when to ask for help. We’ve probably all learned that at some point we could use some support.
Speed is so vital in self-service analytics! Let me iterate on that: speed is the game!
If you have the chance to find a Tableau consultant that gets your pain points, you might be able to accelerate your progress in a way you didn’t believe possible.
So how can we help?
A creative approach to problem-solving. Diligent Tableau help, clear communication, doing things the right way.
Simple as that!
A Passion for Data Visualization
We are working with Tableau every single day. We tirelessly feed the beast that is our appetite for answering questions with data!
Our professional web analytics experience gives us a cutting edge. We above all understand the importance of correctness and quality of data.
We believe that when you’re passionate about something, the work becomes a lot easier. For us, it doesn’t even feel like work!
The love for working with data is what drives us. Tenacity, dedication, and creativity are what you will get from us.
What we can actually do: Tableau Professional Services
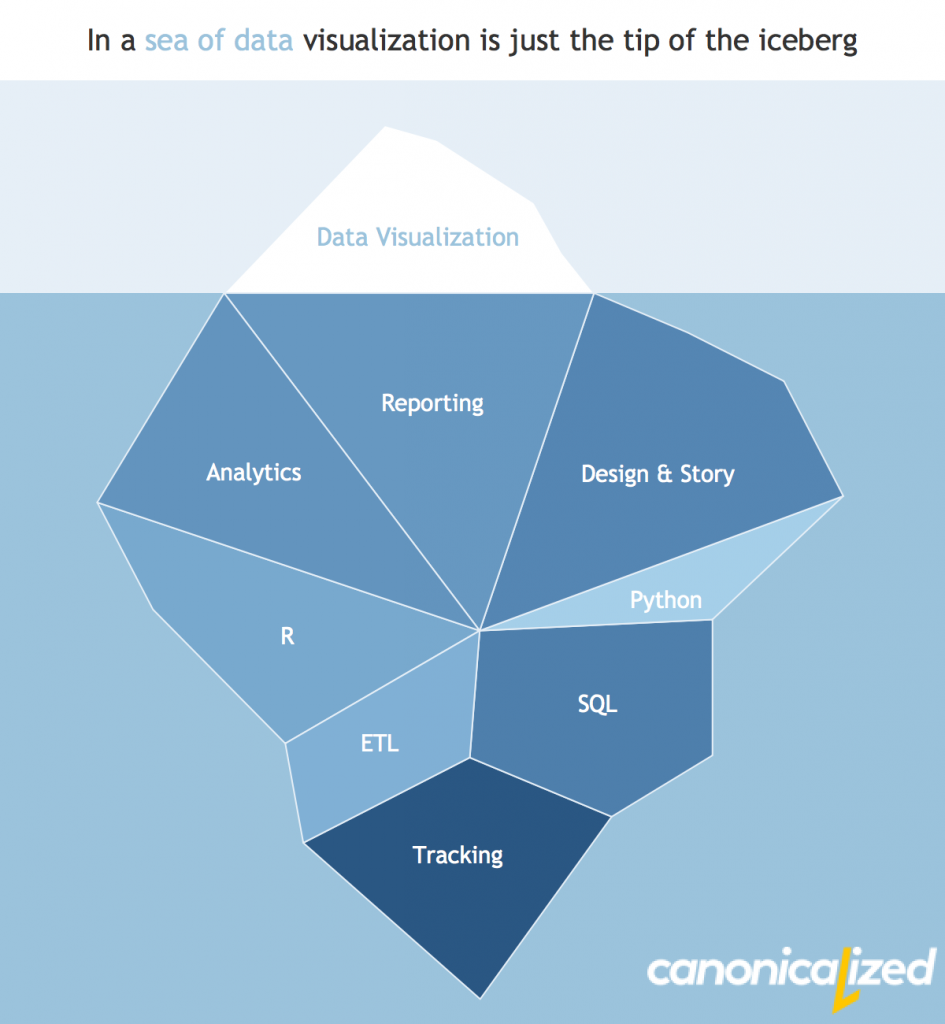
(*we created this image with Tableau; clicking on it will take you to the Tableau Public version)
Business Analytics vs. Business Intelligence
We believe that you can benefit from our work in both areas. By combining efficiency (BI) with creativity (BA), we’re trying to help businesses answer pressing questions and formulate new ones.
We have been using a broad spectrum of data sources: ranging from the big data ones like Exasol or Vertica to classic databases like MySQL or Postgres, and less traditional ones like Google Analytics and web data connectors.
Dashboard Design & Implementation
For us, a Tableau Dashboard is just the tip of the iceberg. The rule of spending 80% of the time on working with the data and 20% on the visualization itself applies to our case.
Not only that, but the Pareto principle is also relevant for the number of sheets we create versus how many we keep in the final version of the dashboard.
The speed of trying different approaches in Tableau is fantastic! It would be a shame if we didn’t use it.
We usually start by building a lot of different charts (sometimes hundreds), and we keep only the ones we feel that are relevant to the story.
You can find a few examples of data visualizations we’ve built at the end of this page. And some more creative dashboards on Dorian’s Tableau Public profile (our Tableau boss).
Tableau Performance Optimization
We have a case study on Tableau performance tuning, which you should read if you have ~15 minutes available.
The main idea is that we don’t focus solely on how fast we can make a dashboard, but also on quick it can answer your questions.
Also, working with large amounts of data is tricky! However, we are here to break through those walls.
Licensing & Support
Looking to make the right choice regarding the Tableau setup within your organization?
We can help you figure out what is the right mix of:
- Tableau products: Desktop, Prep, Server, Online
- User roles: (Creator, Explorer, Viewer)
- Licenses: user-based, core licensing, embedded analytics, data management
We are also available to offer technical support for your Server if you need it.
One of our goals is to help clients sleep better. This part falls right into that area.
Complementary experience with R and Python
Technologies like R and Python allow us to work with the data at the closest level.
To name of few things for which we’ve used statistical models built with R alongside Tableau to double-down on analytics:
- Markov attribution models: smarter-than-average marketing channel attribution for e-commerce stores
- Forecasting using algorithms that are a bit more advanced (ex.: Facebook’s Prophet) than the basic ones (like the one used by Tableau)
- Bayesian calculations: we developed these to slice and dice A/B test results right inside Tableau
- CausalImpact checks: we are working with this algorithm to assess whether growths or dips are a result of something we did or just random noise in data
- Business Intelligence workflows: scheduling reports using Python alongside tabcmd (the command line interface to Tableau Server)
Some of our “finished products”
Tableau data visualization examples from our day to day work and some of our creative stuff.

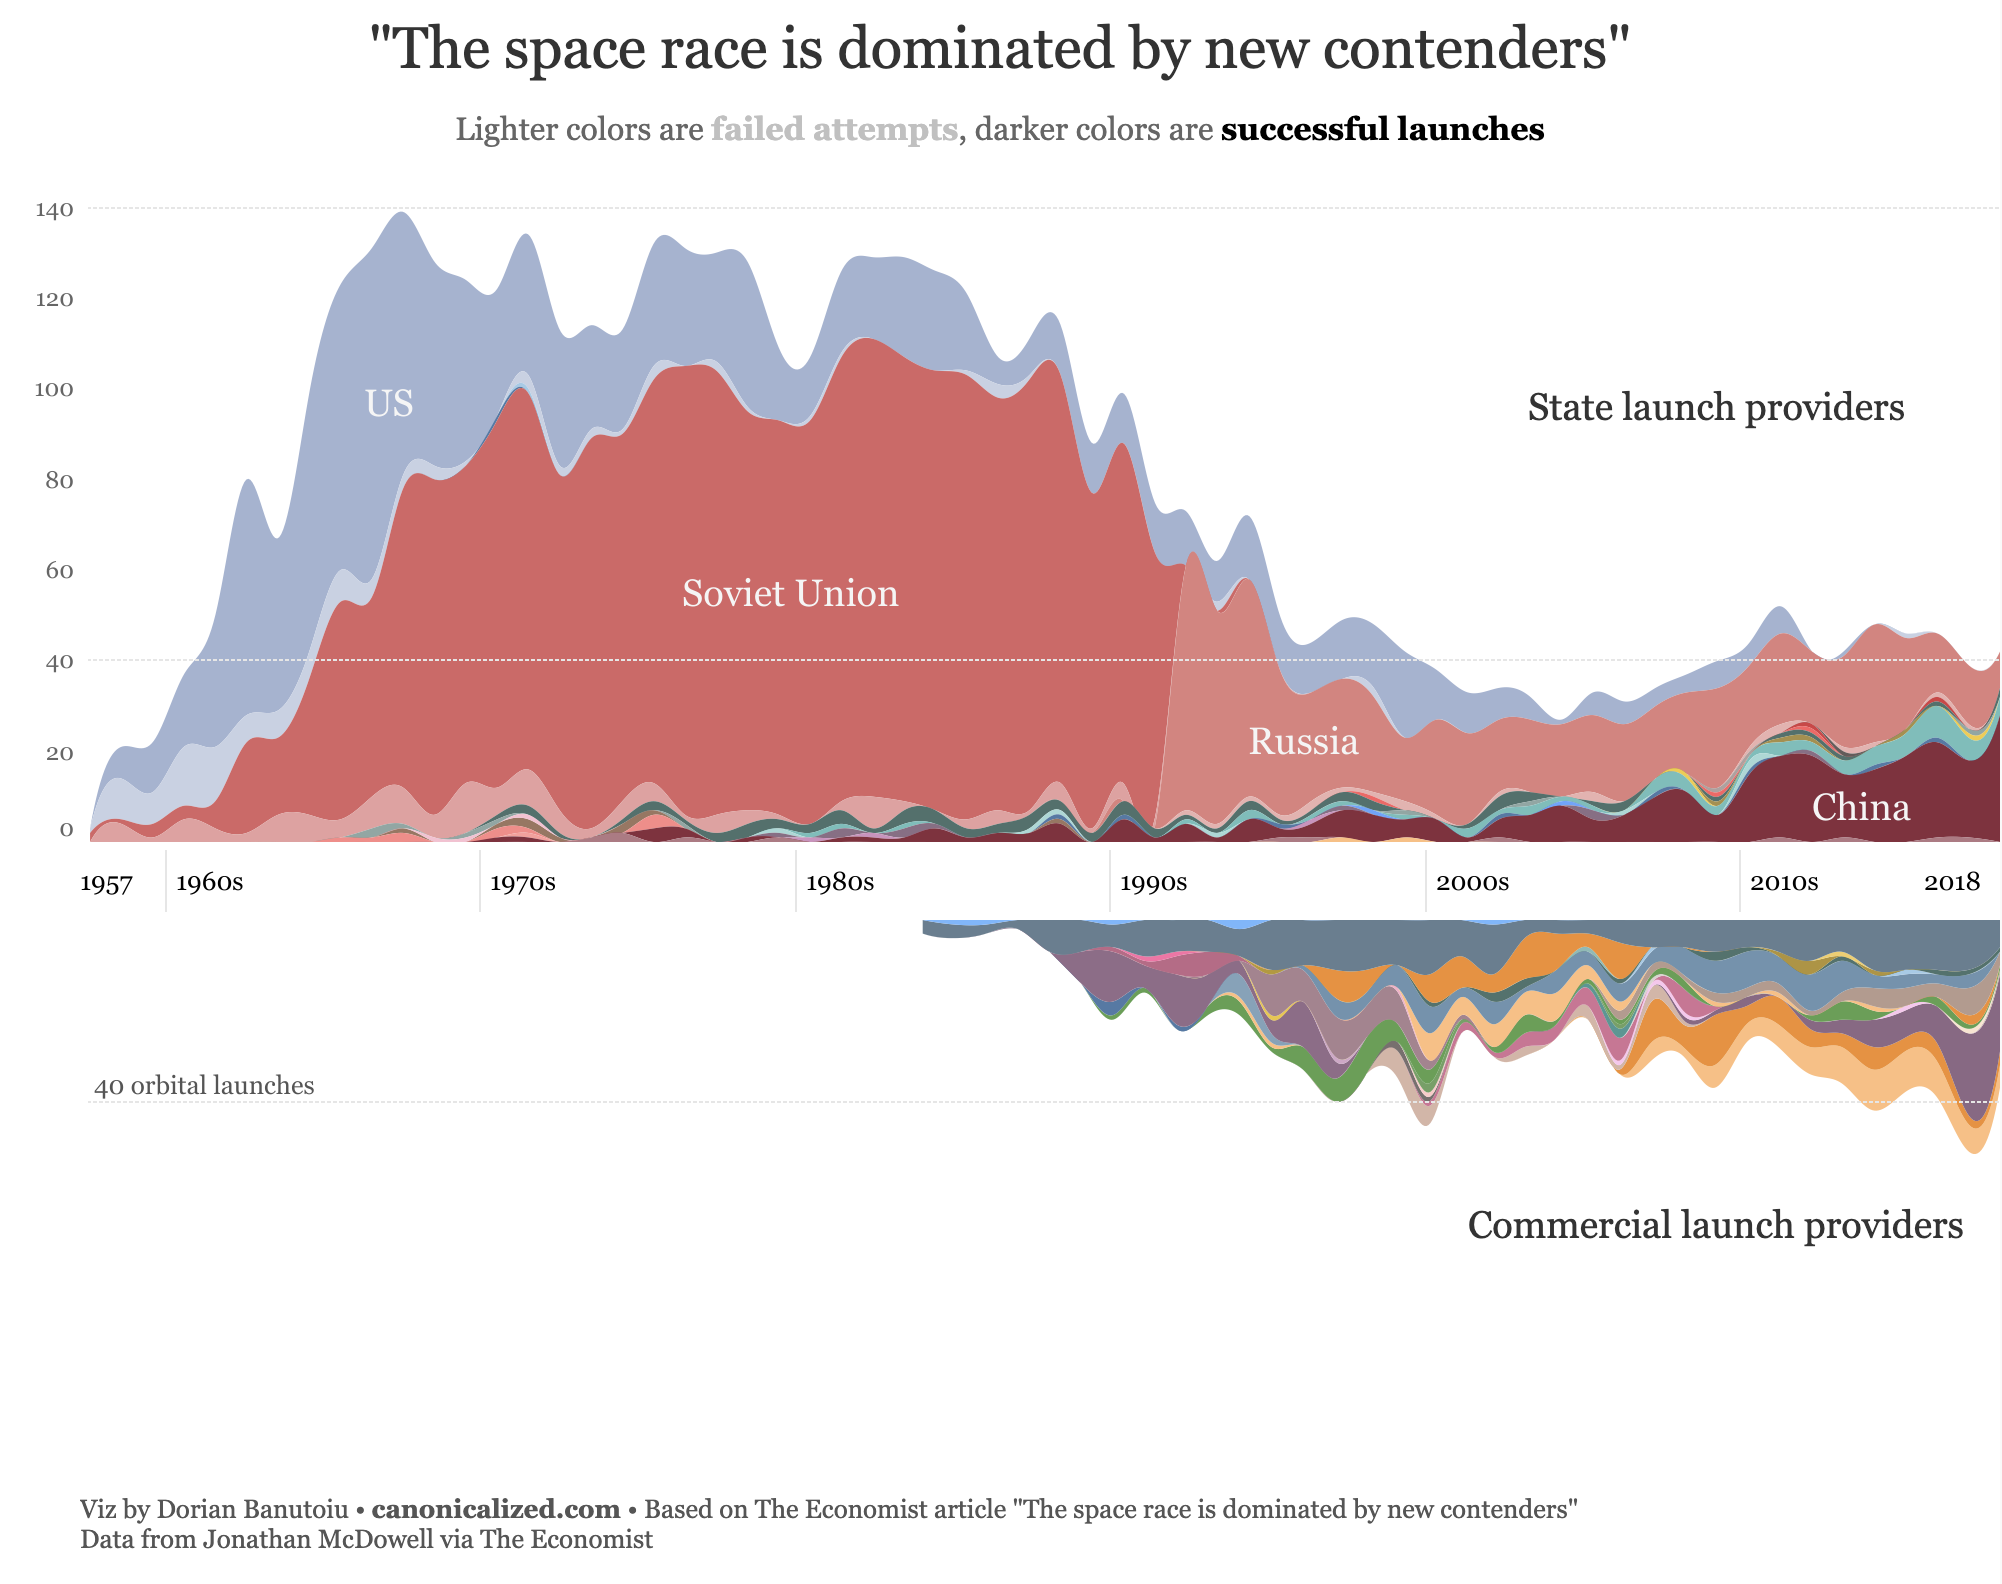
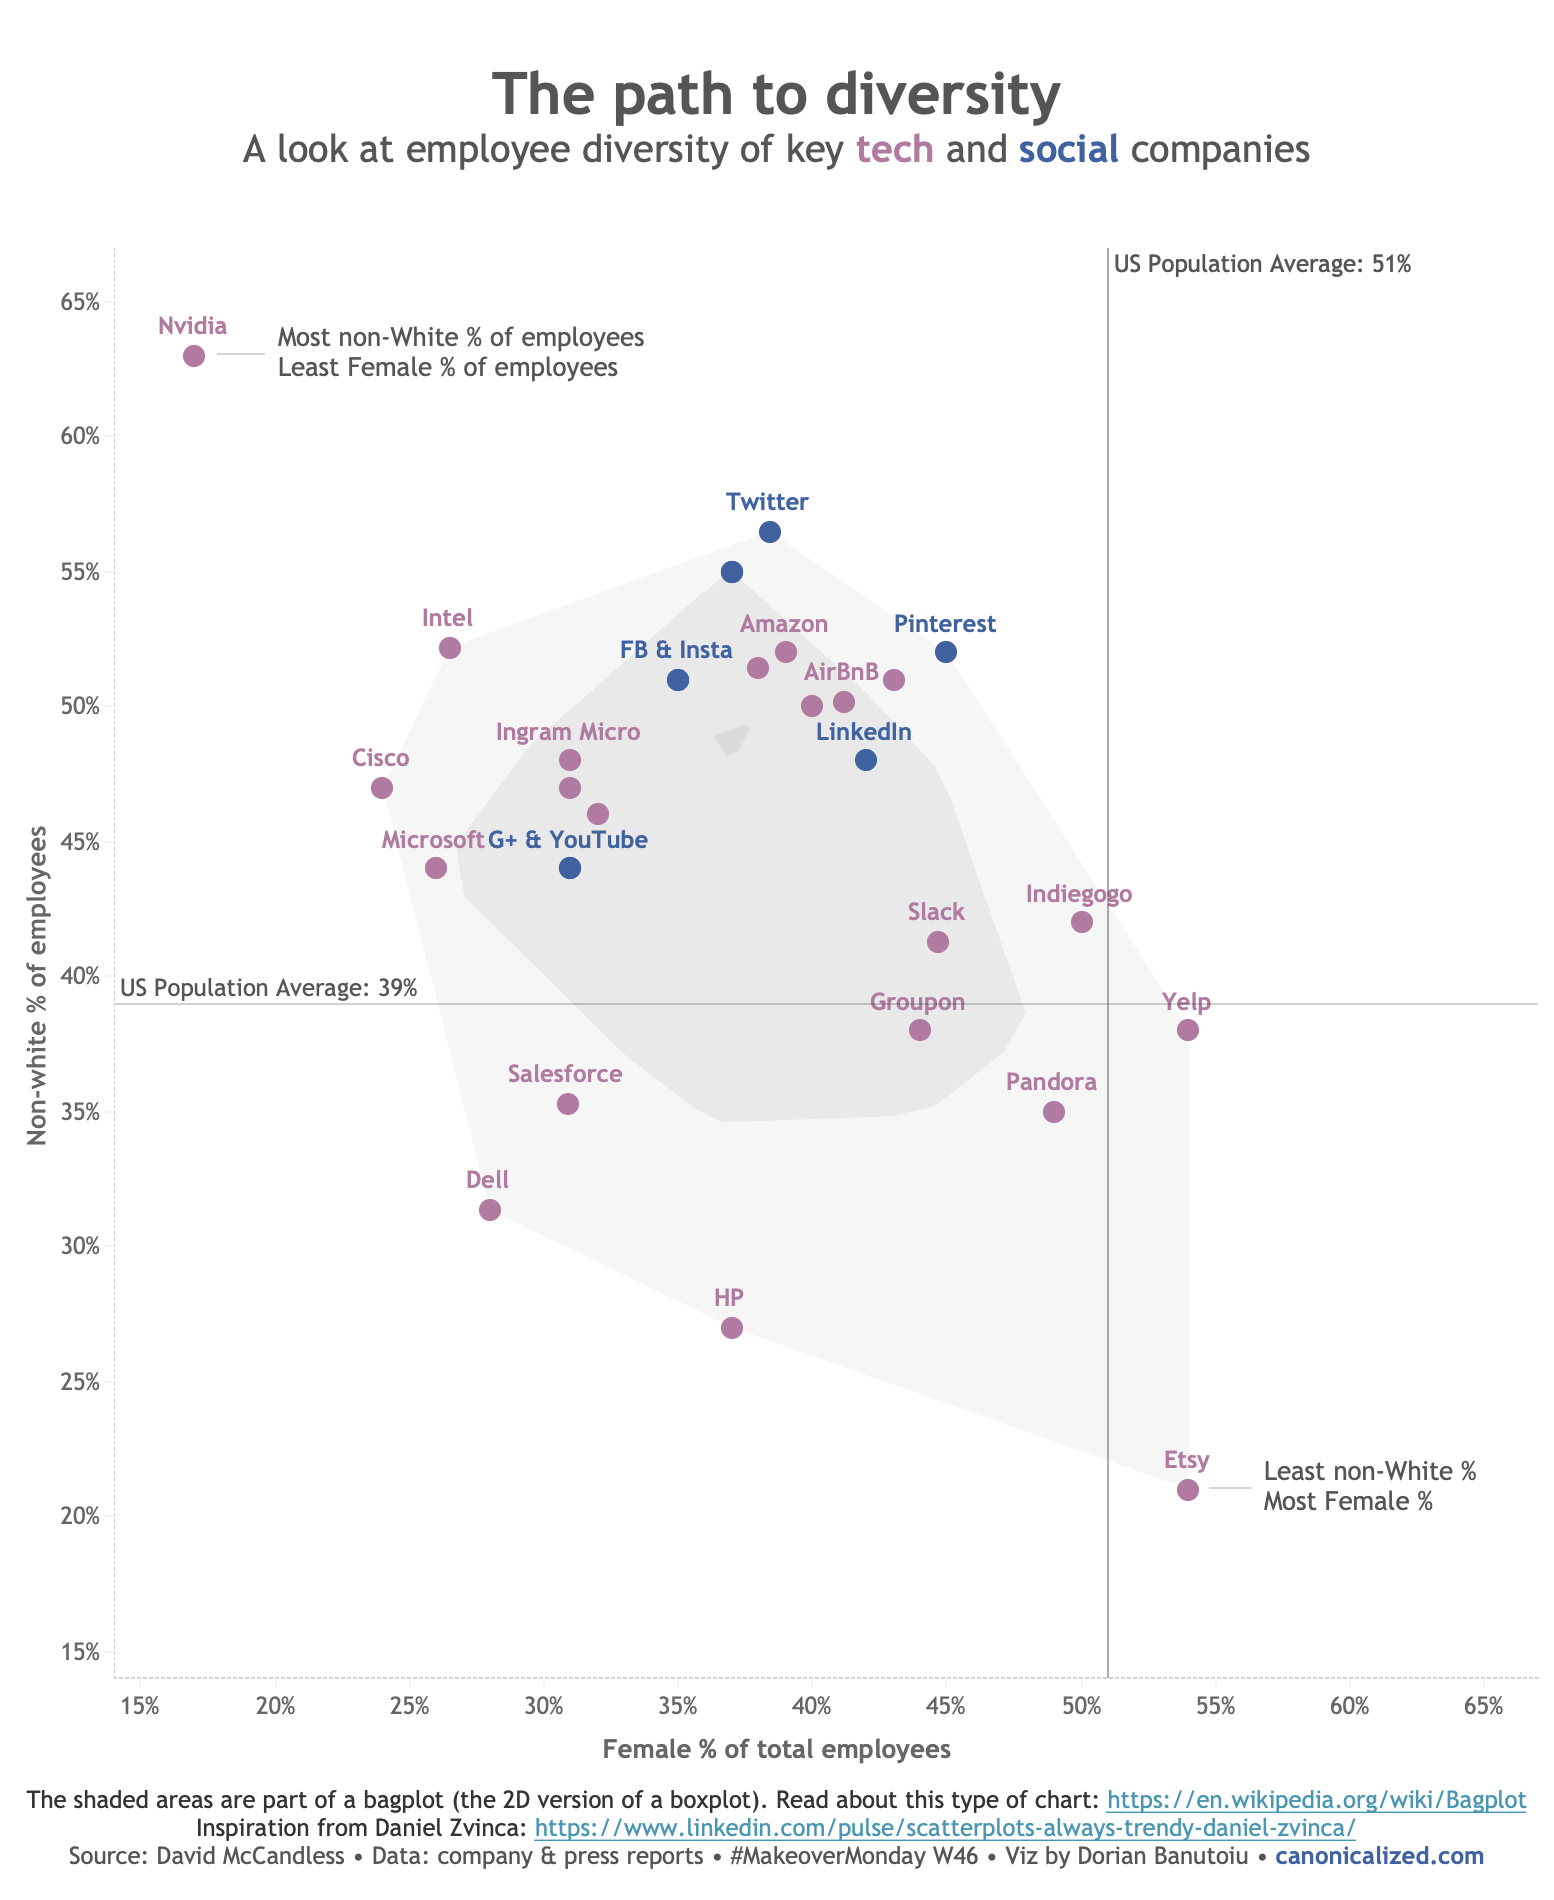

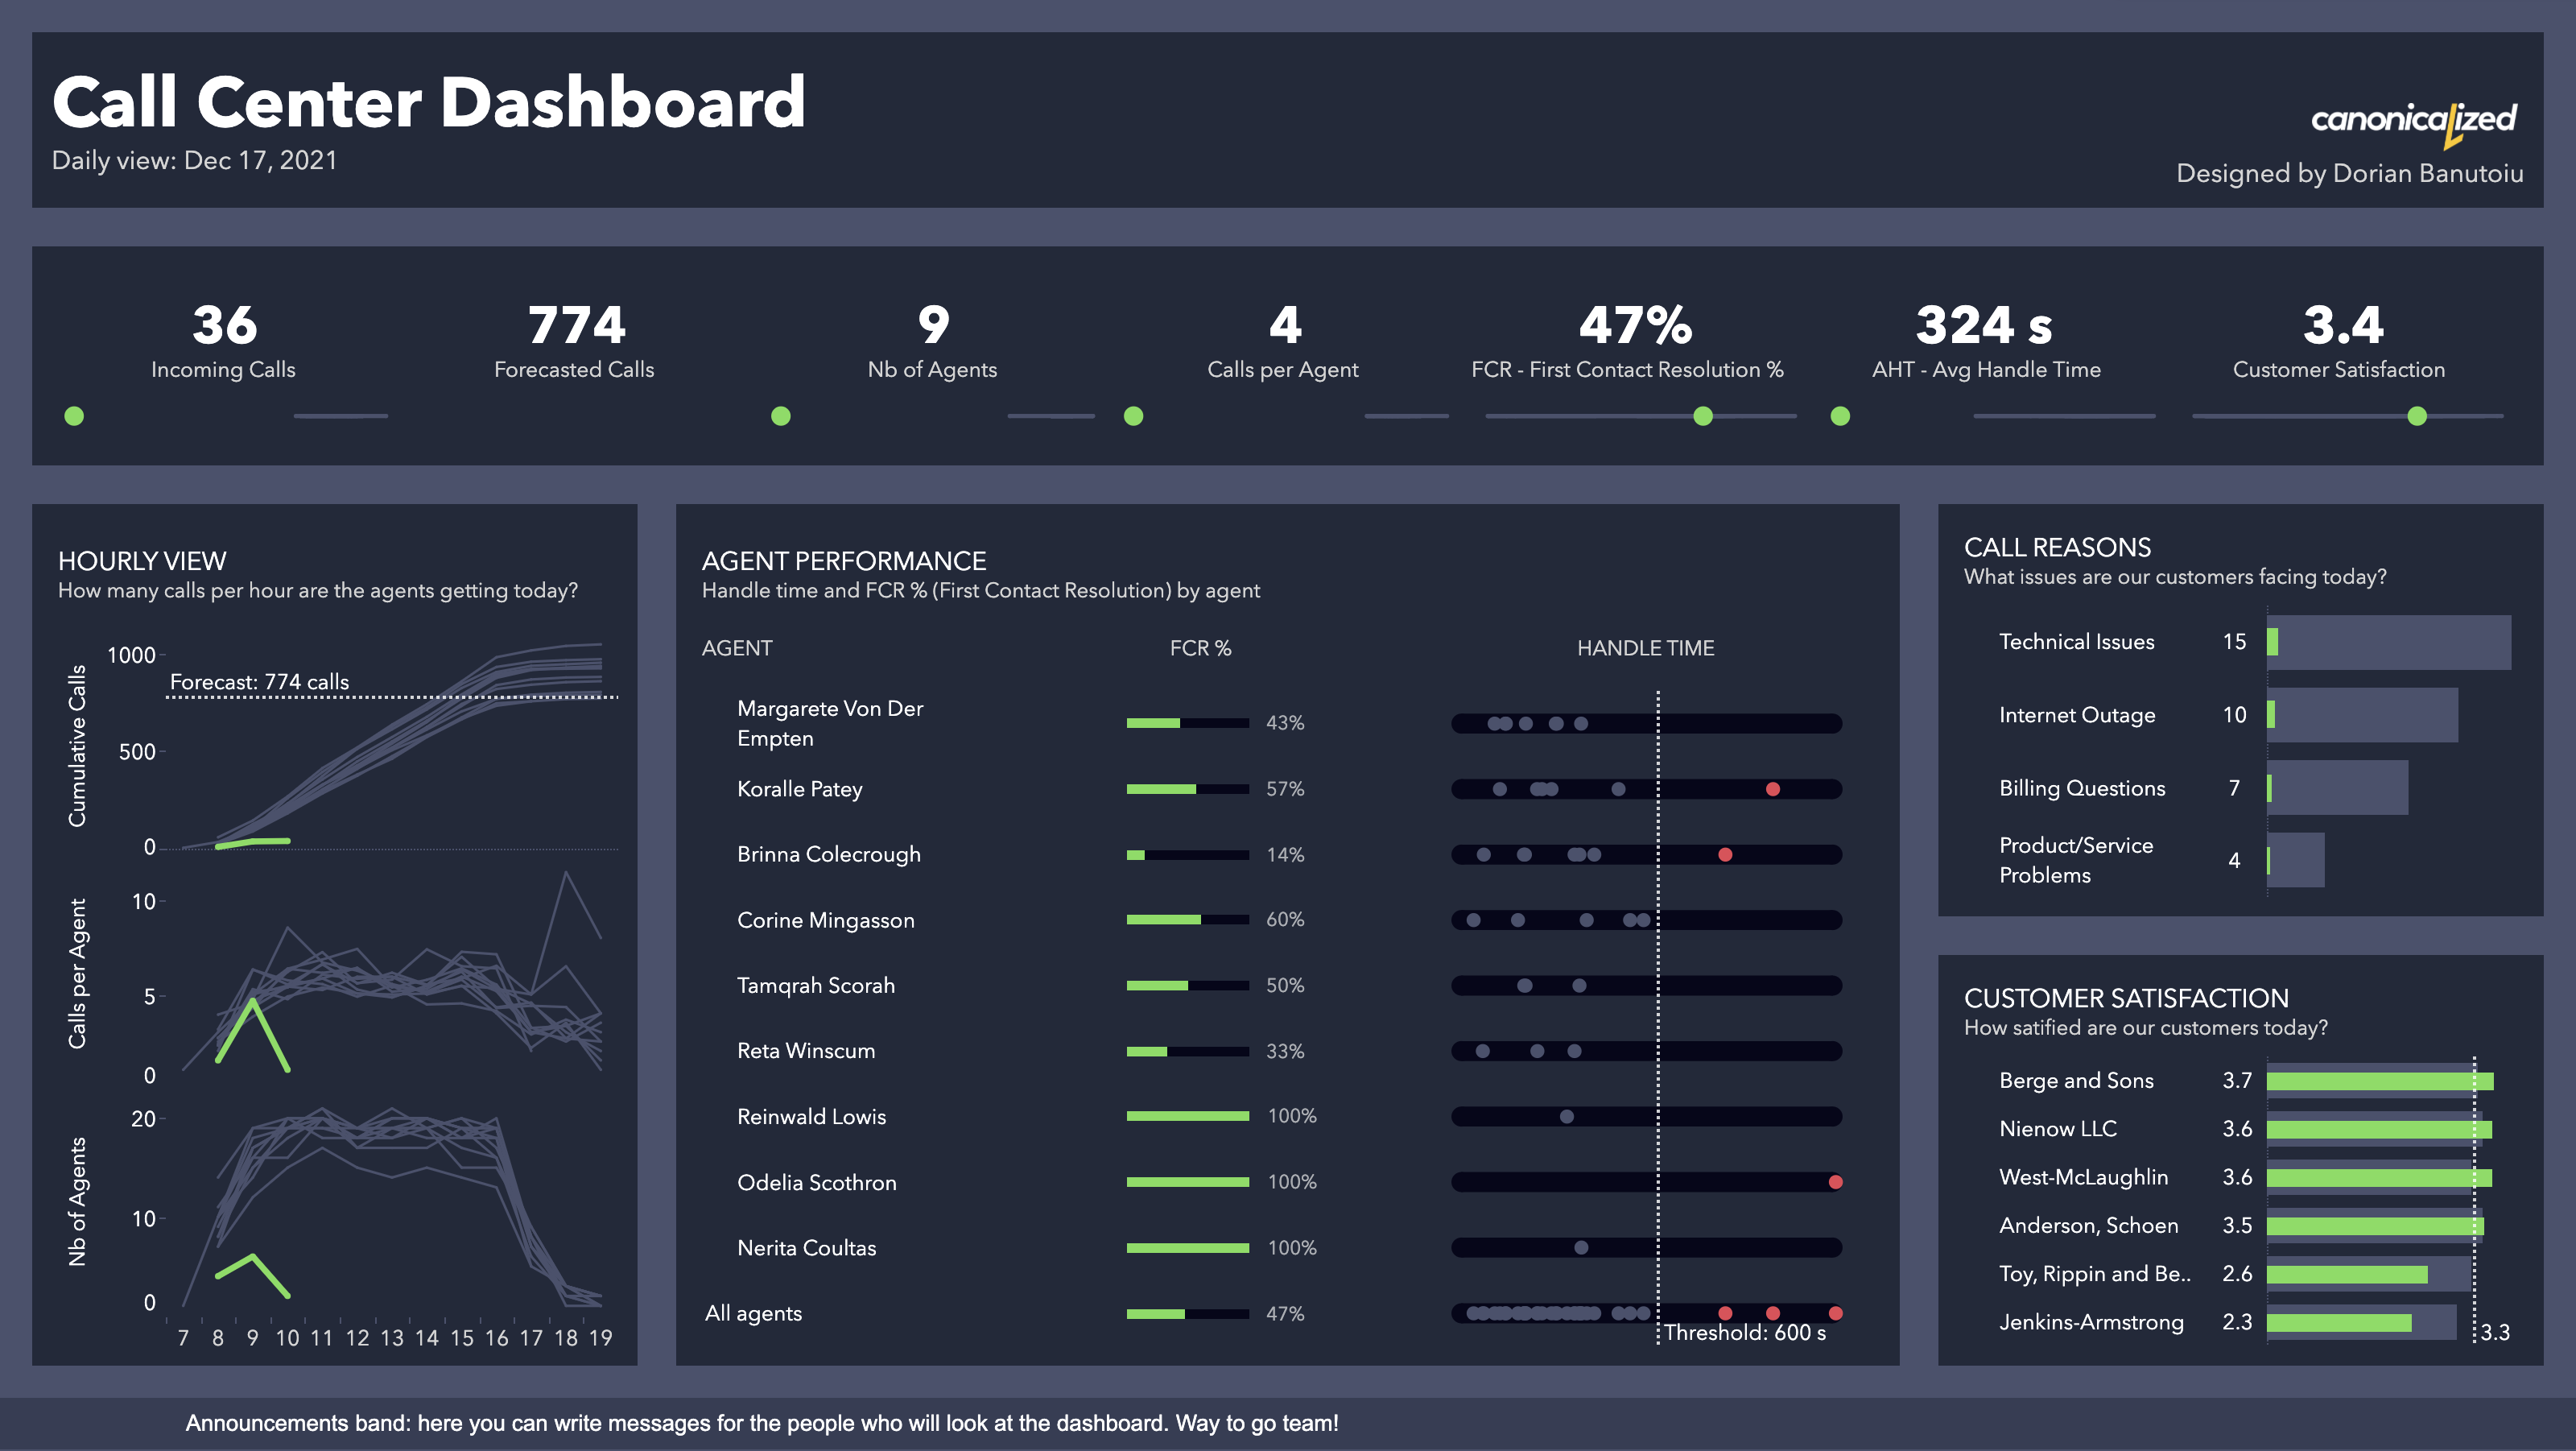
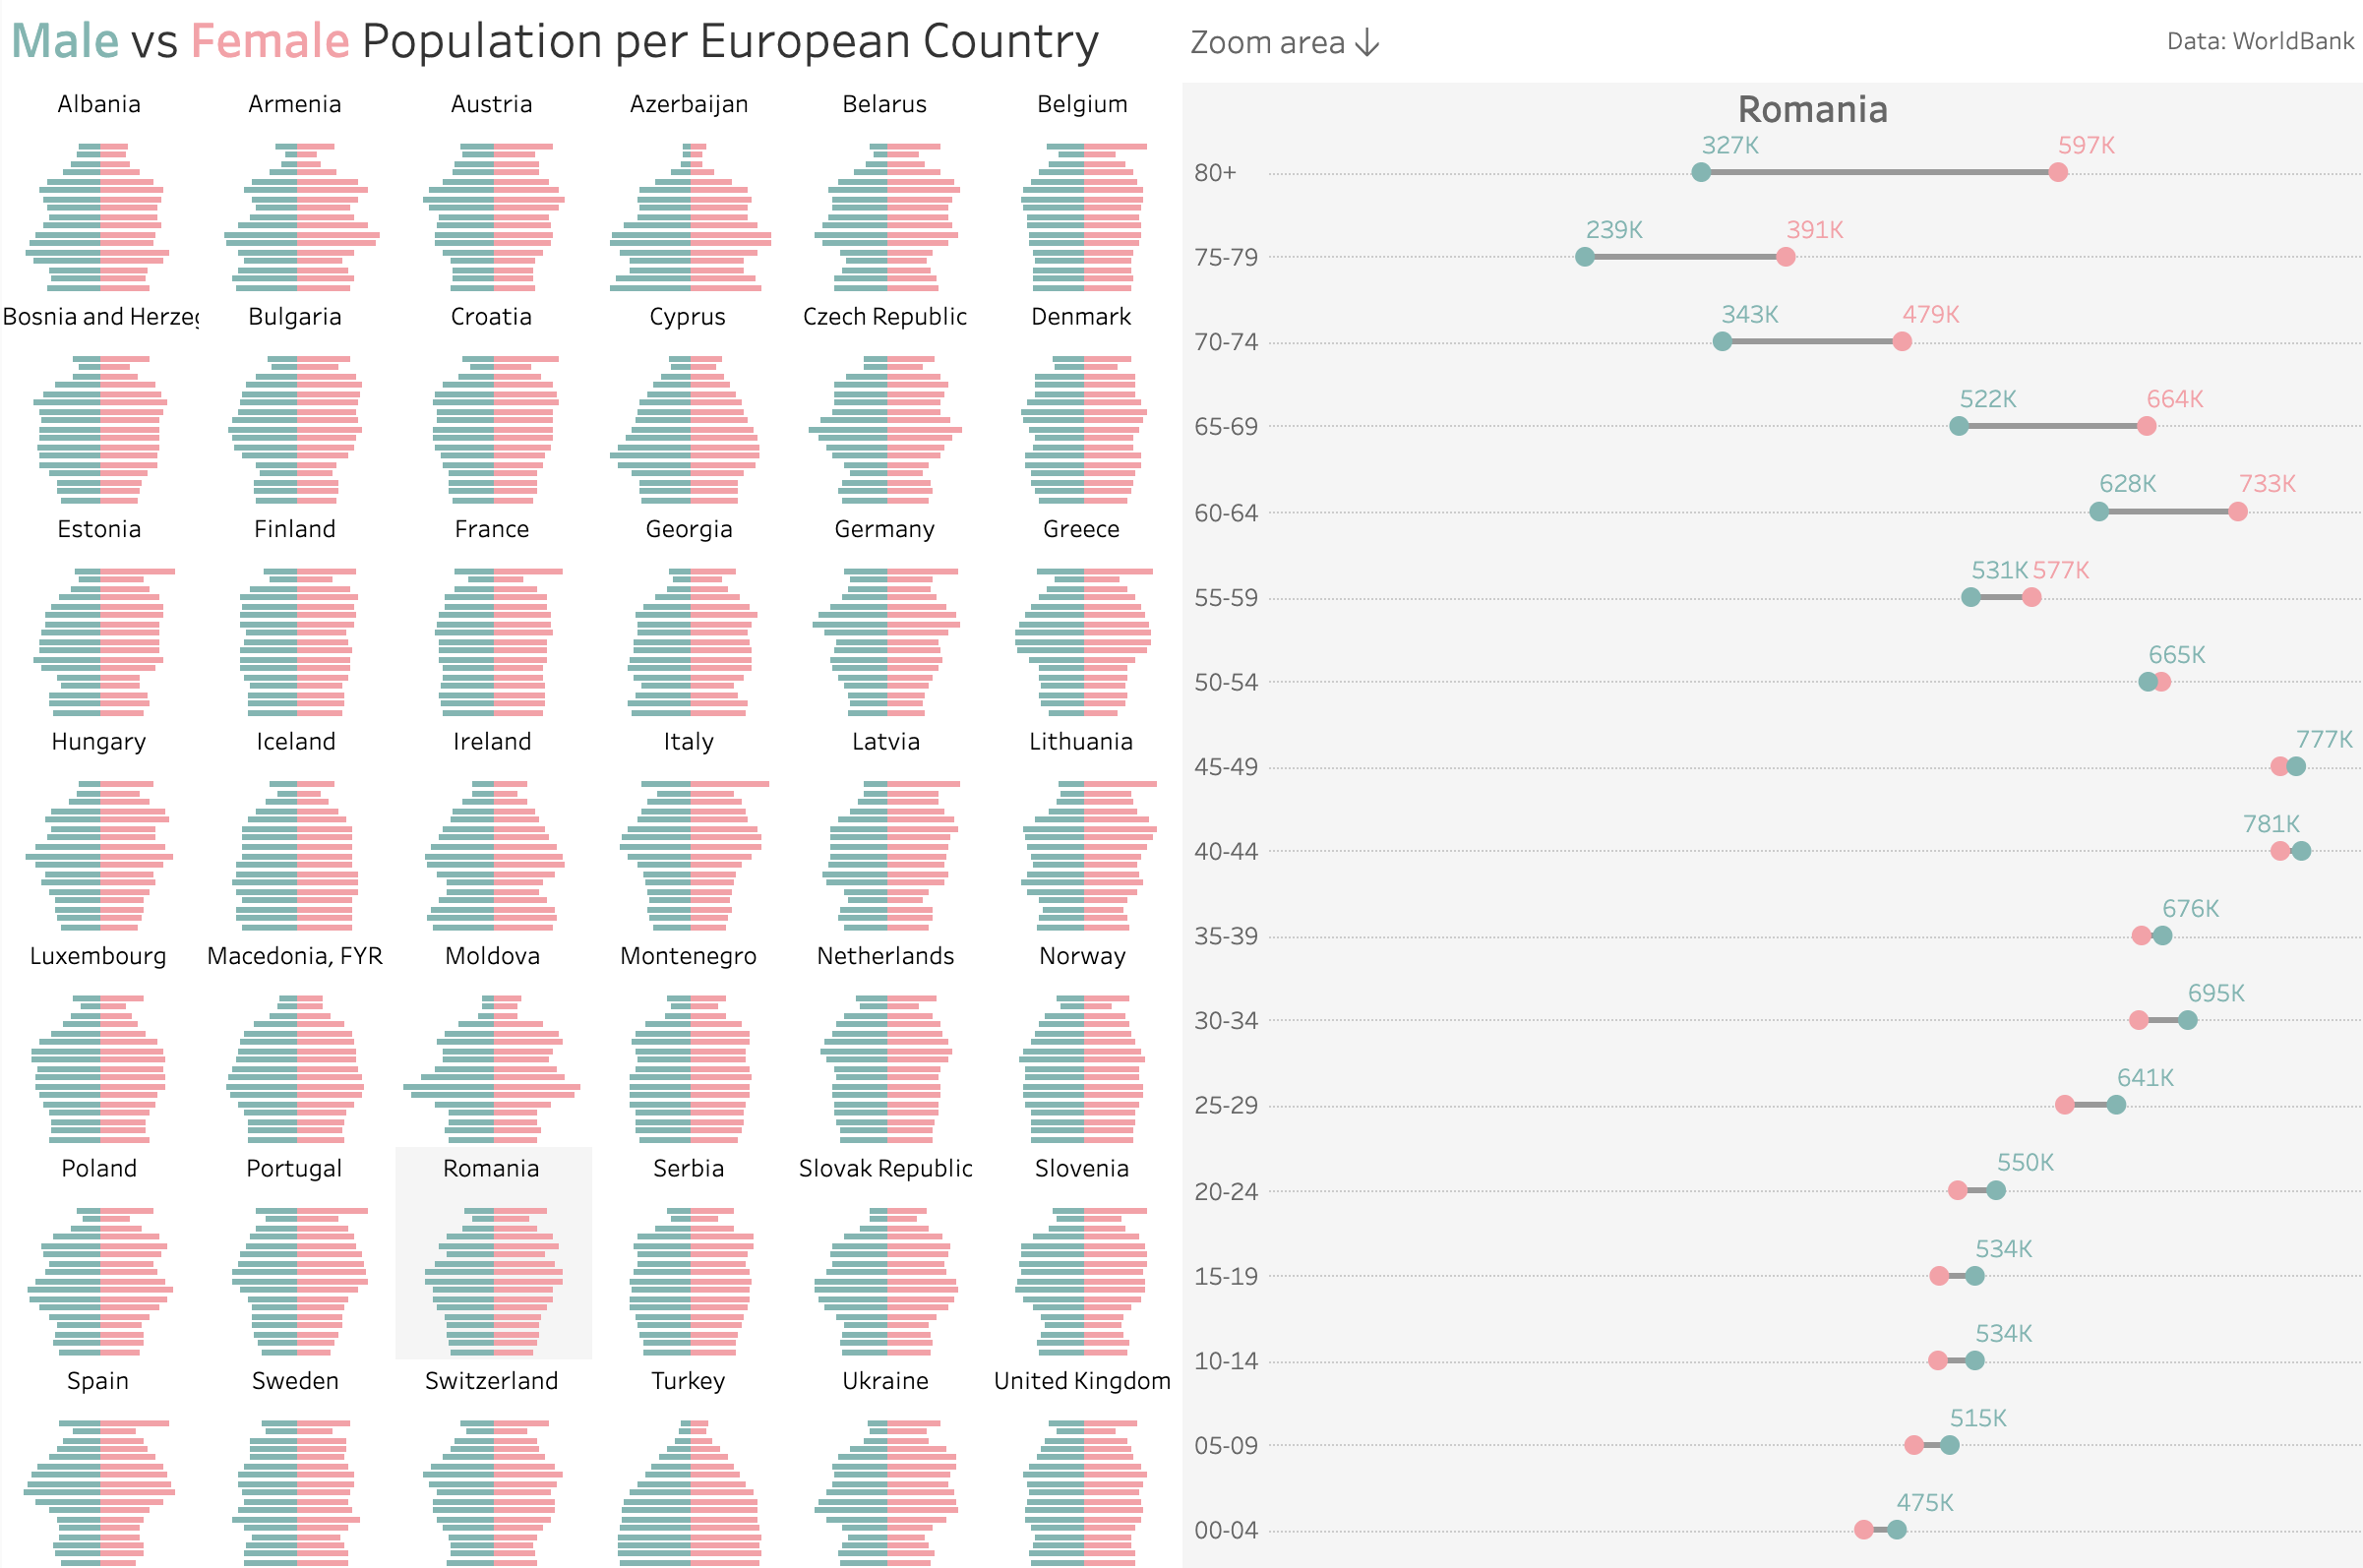

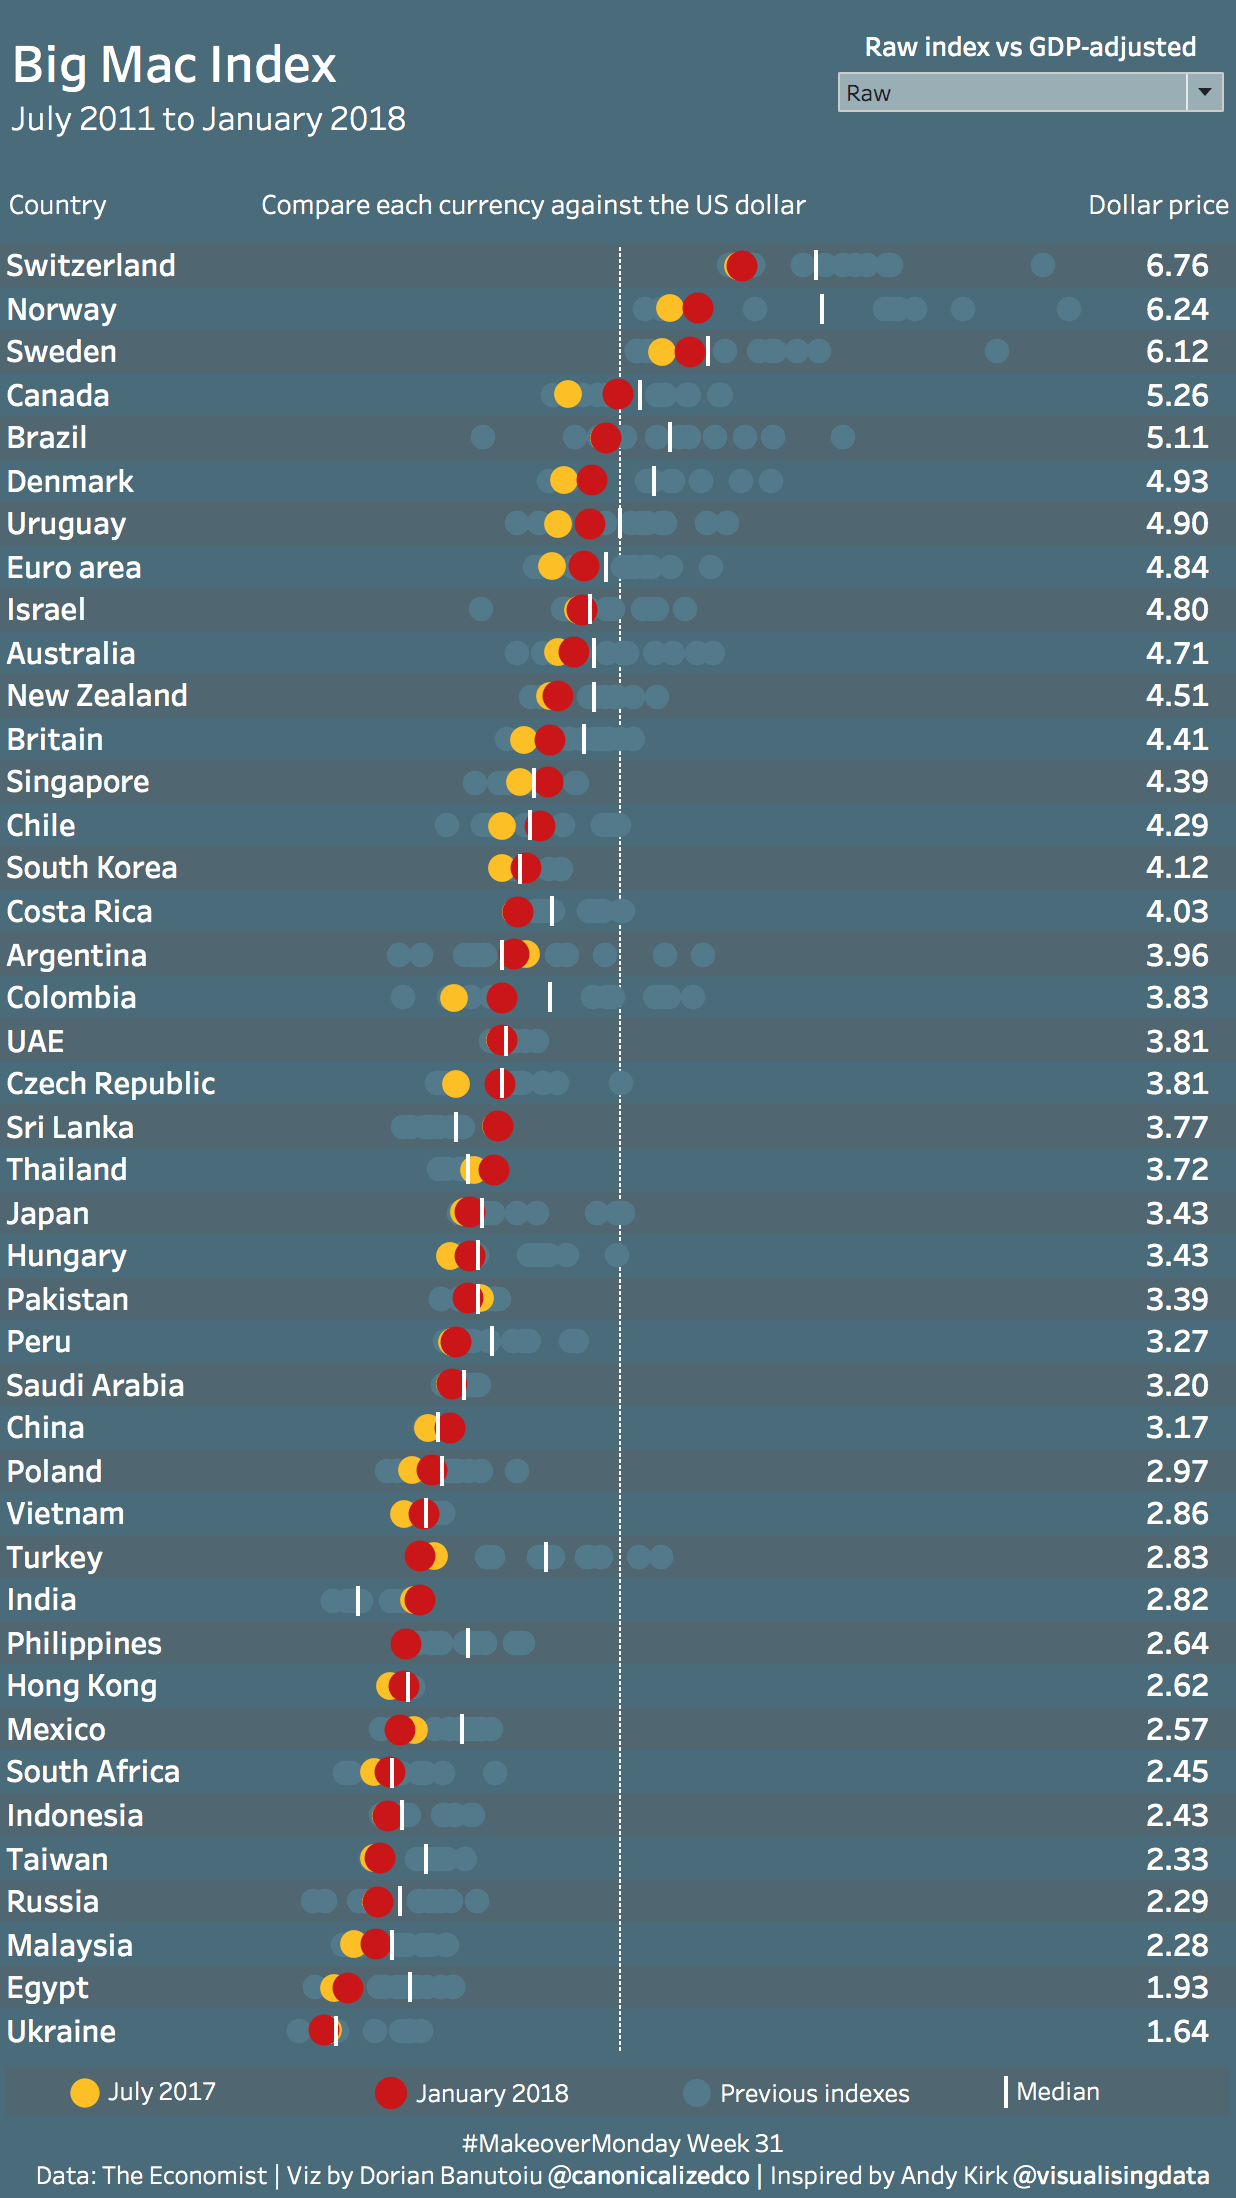

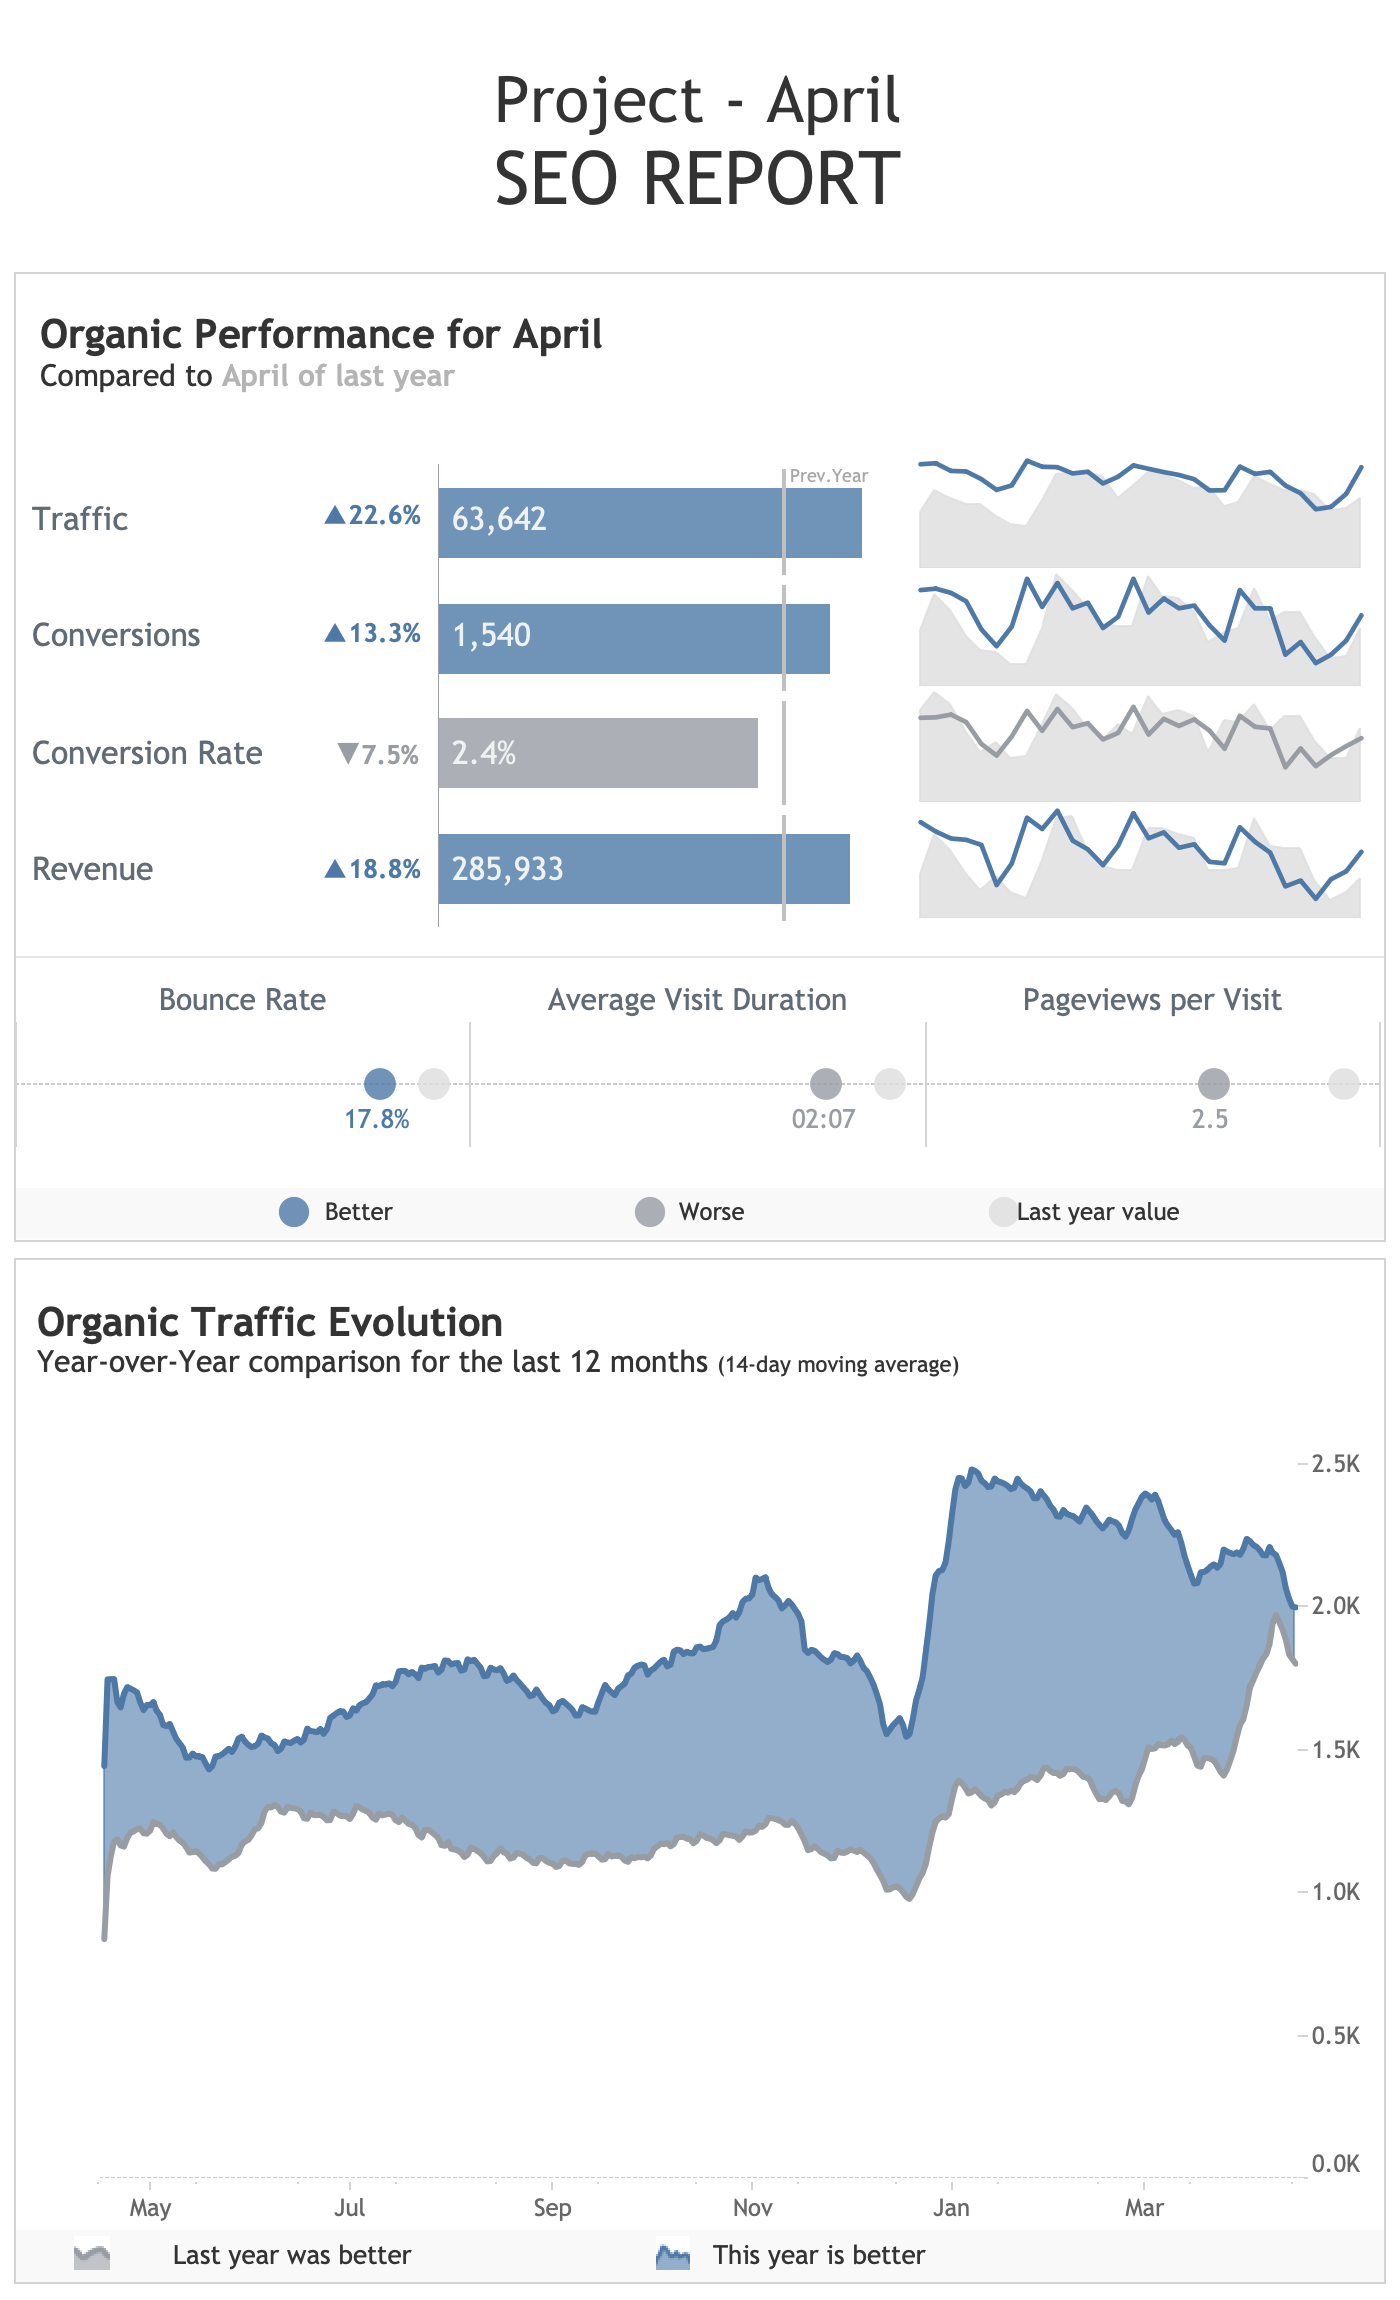

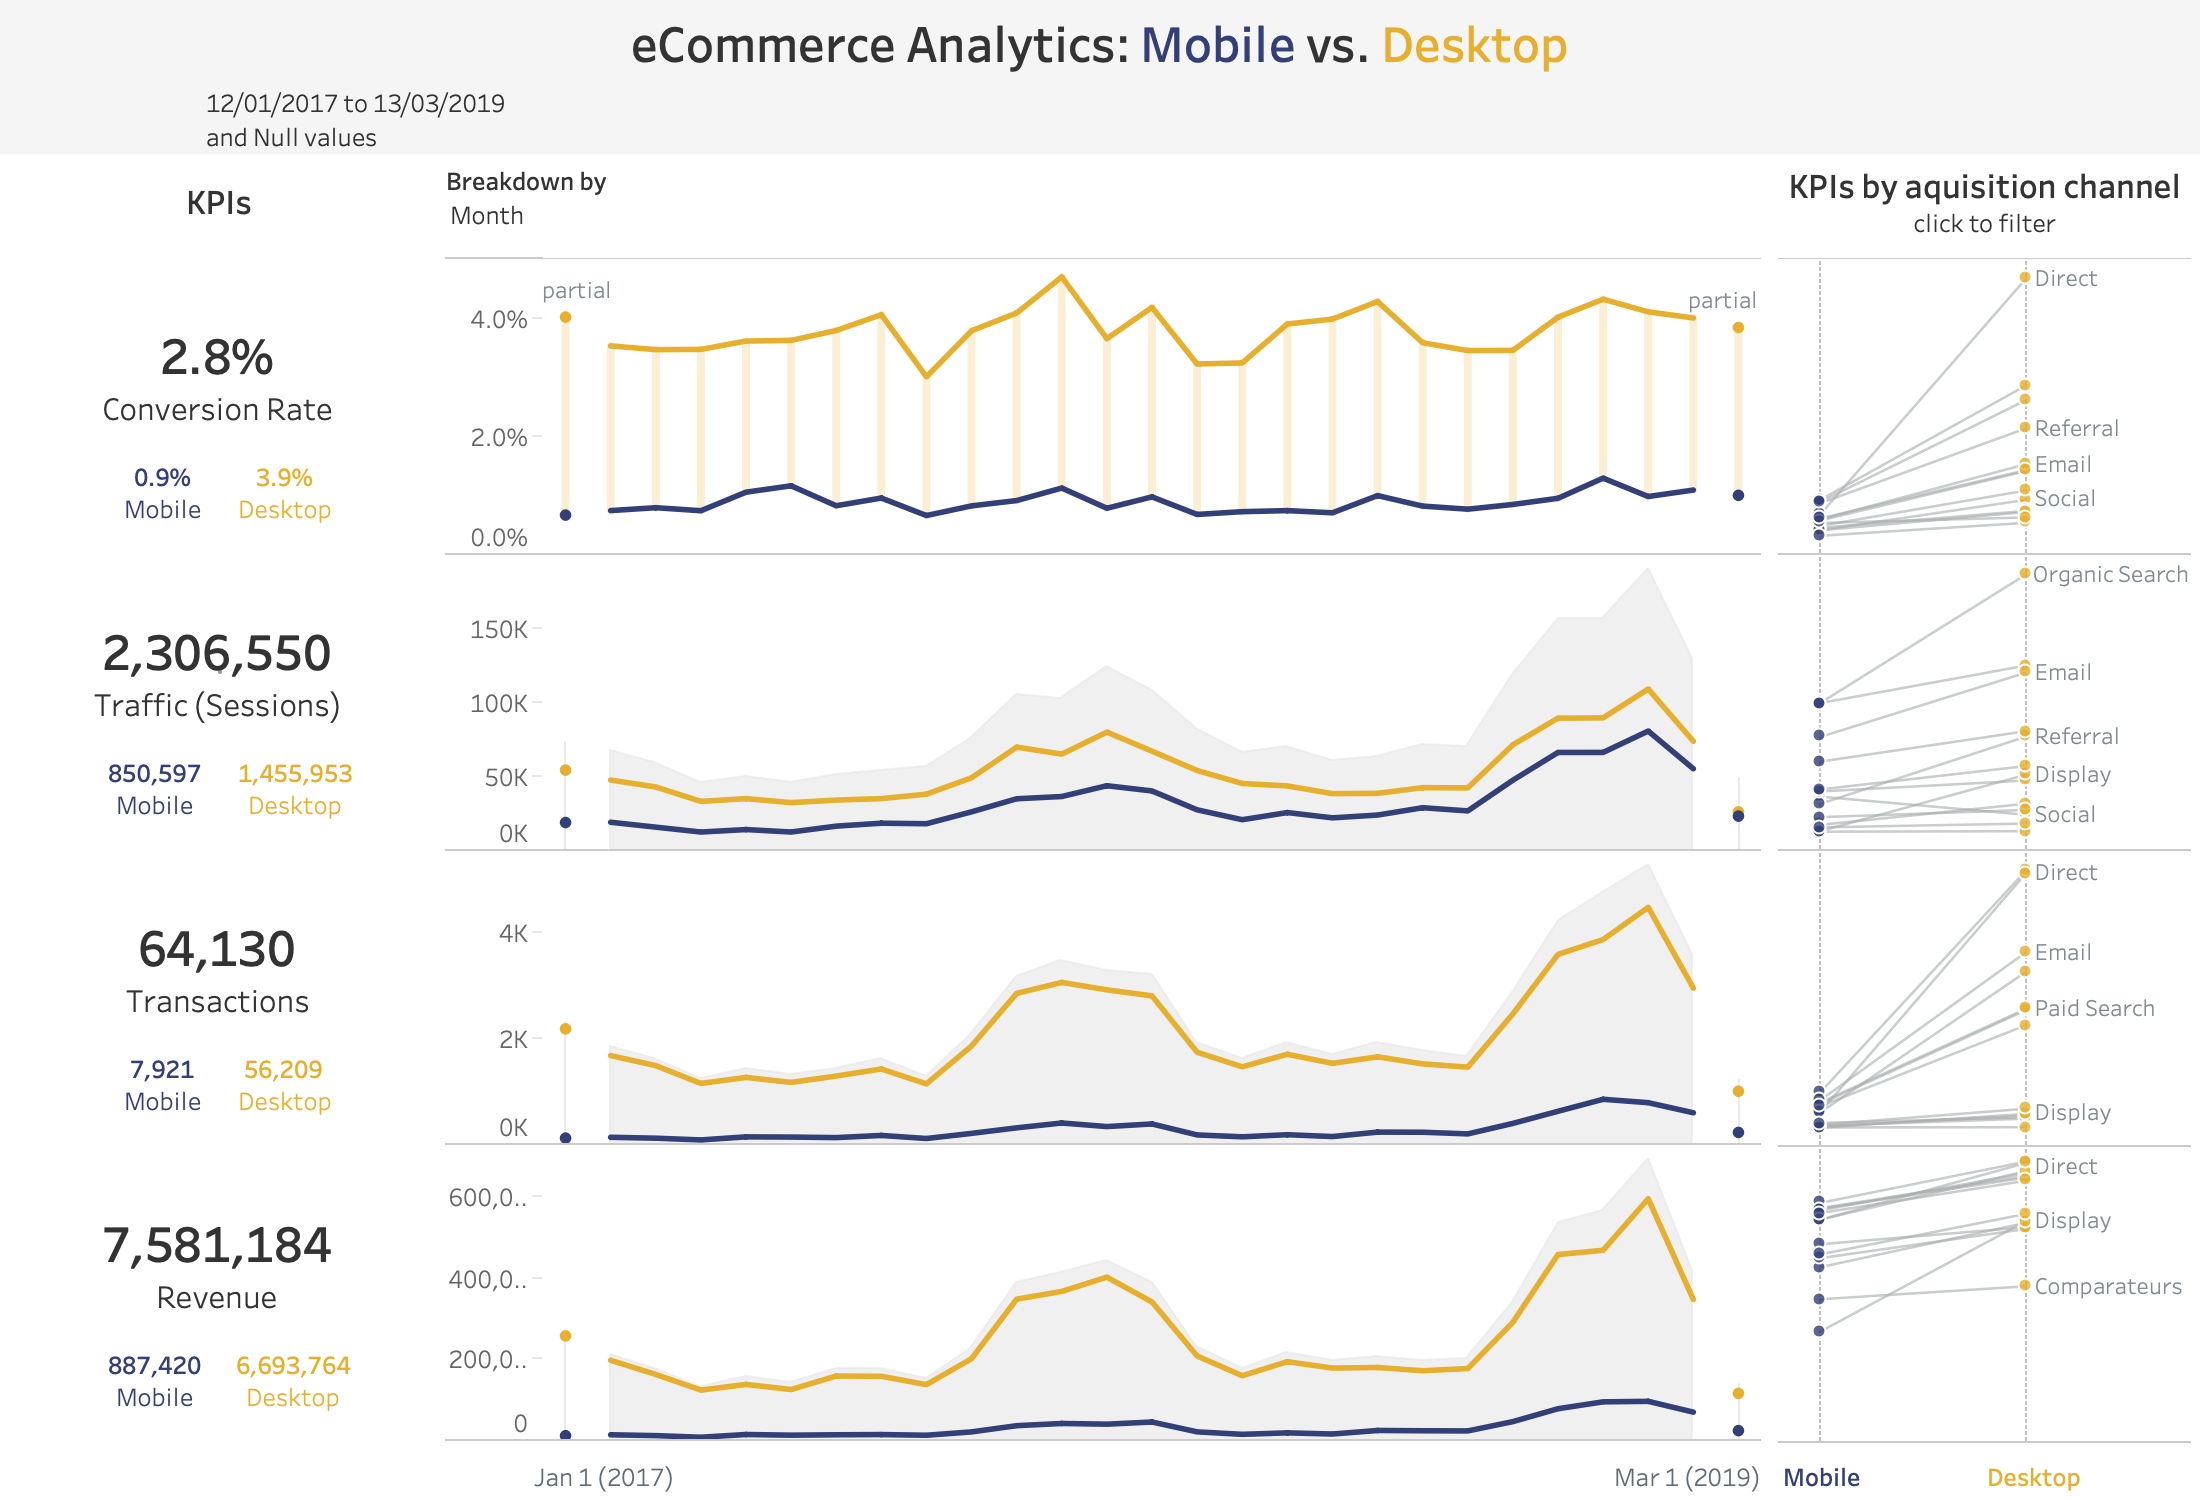
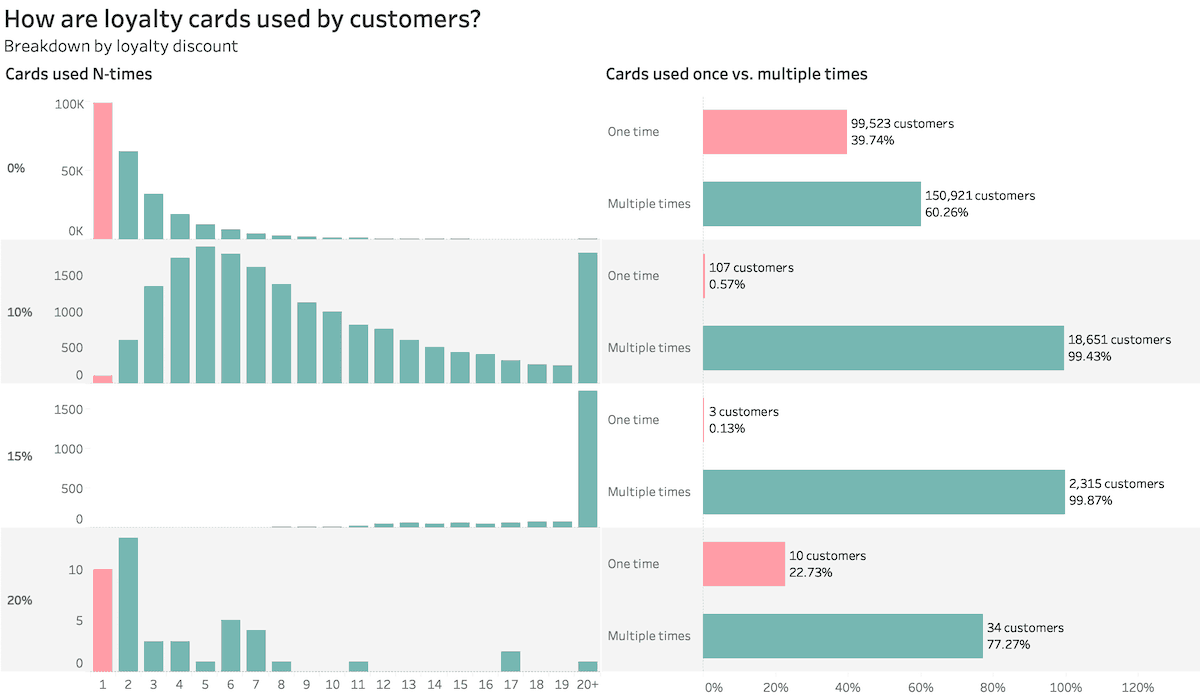
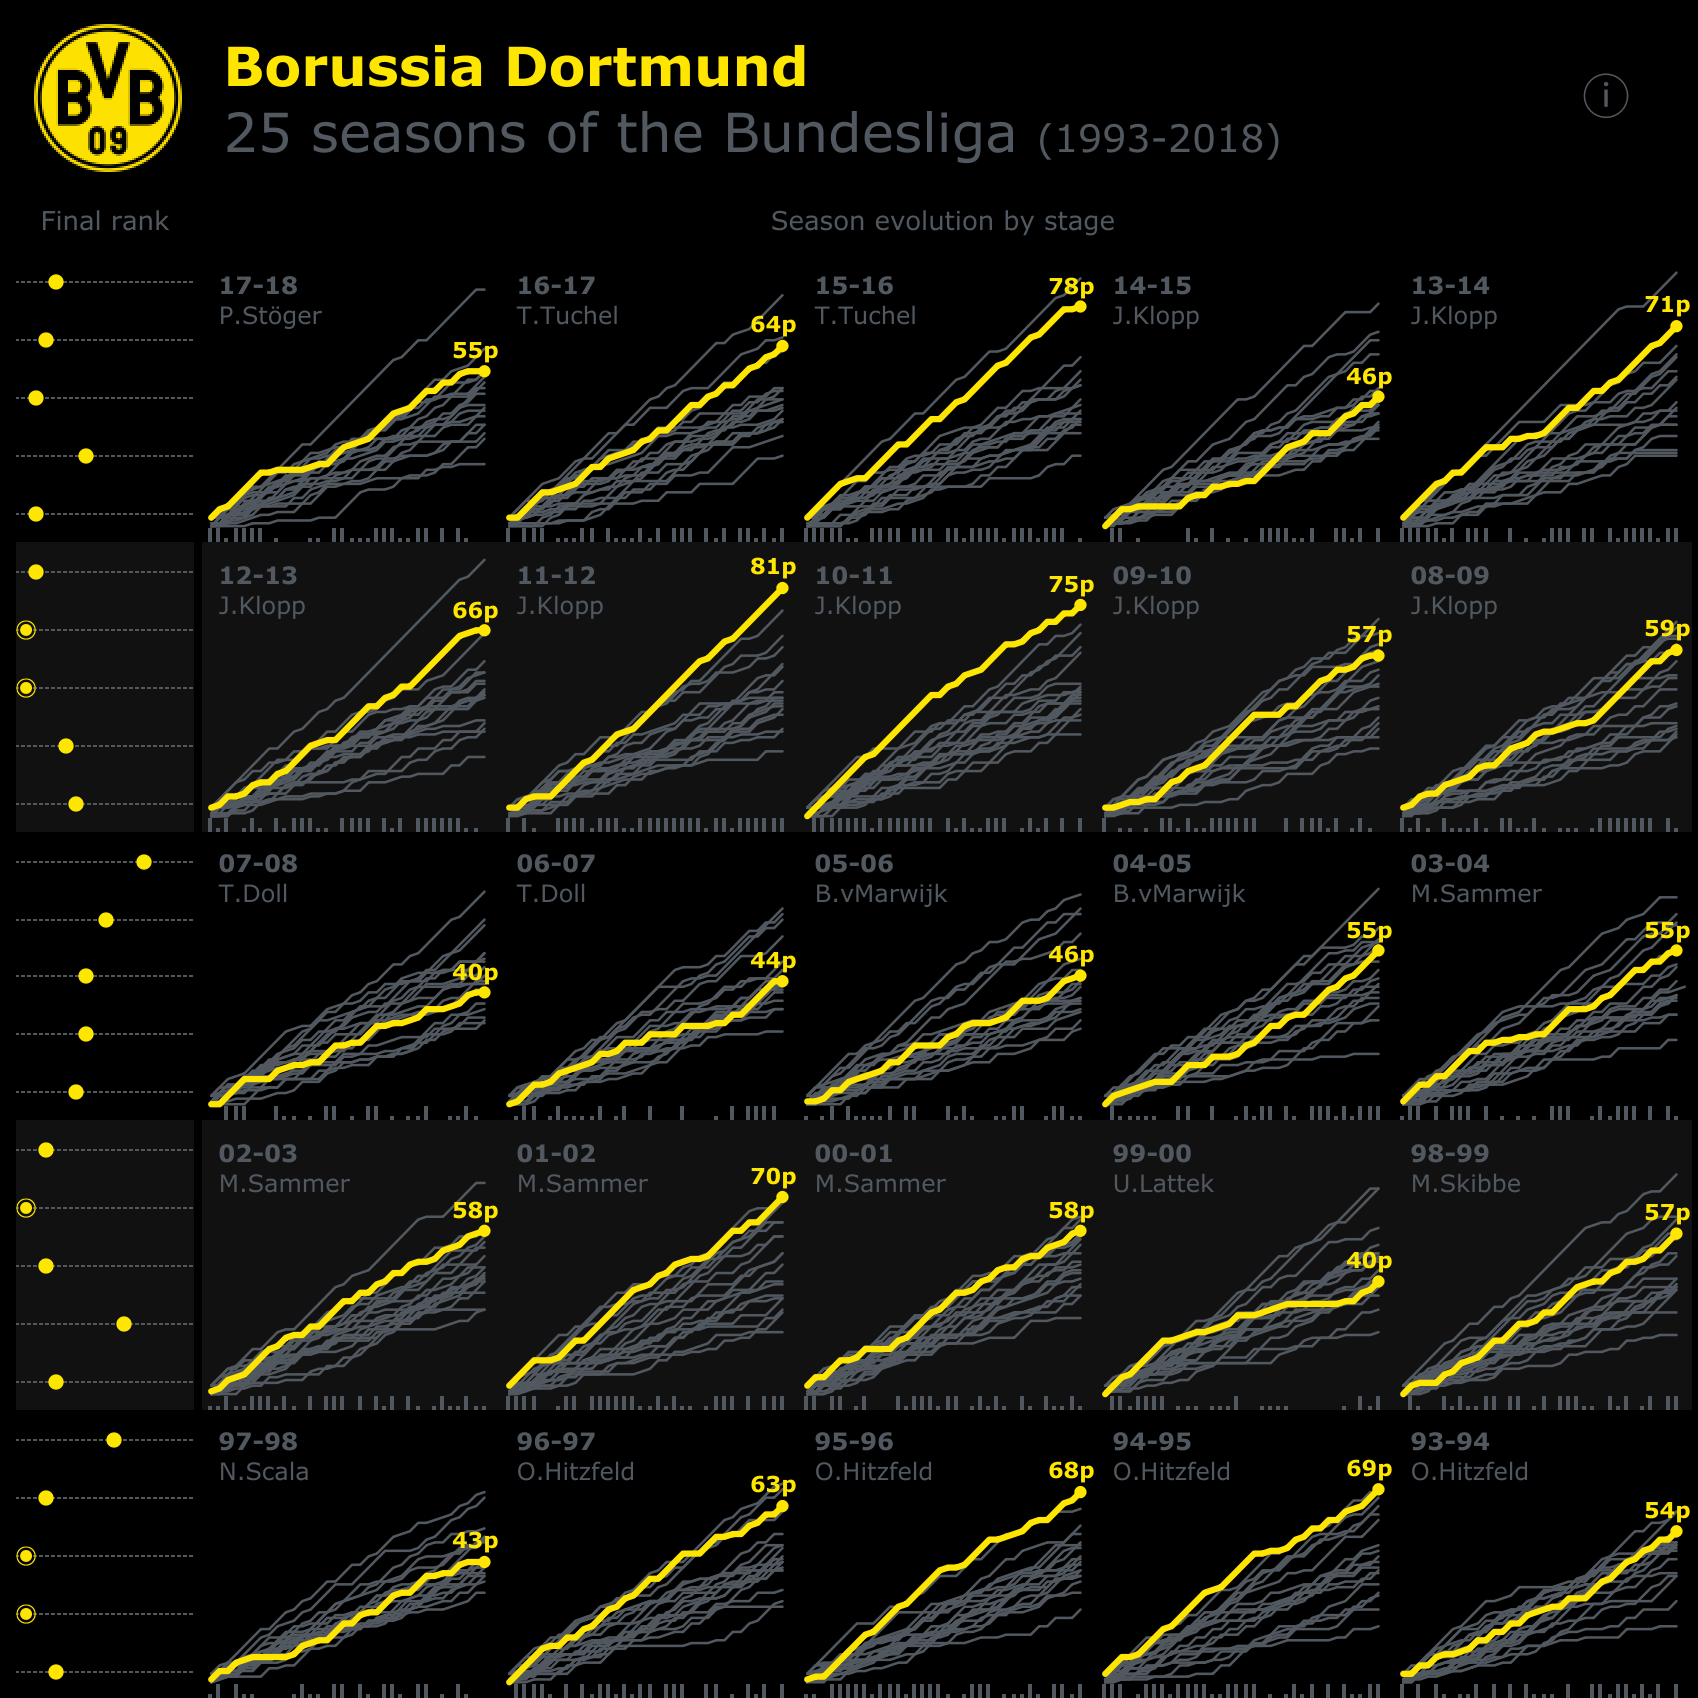

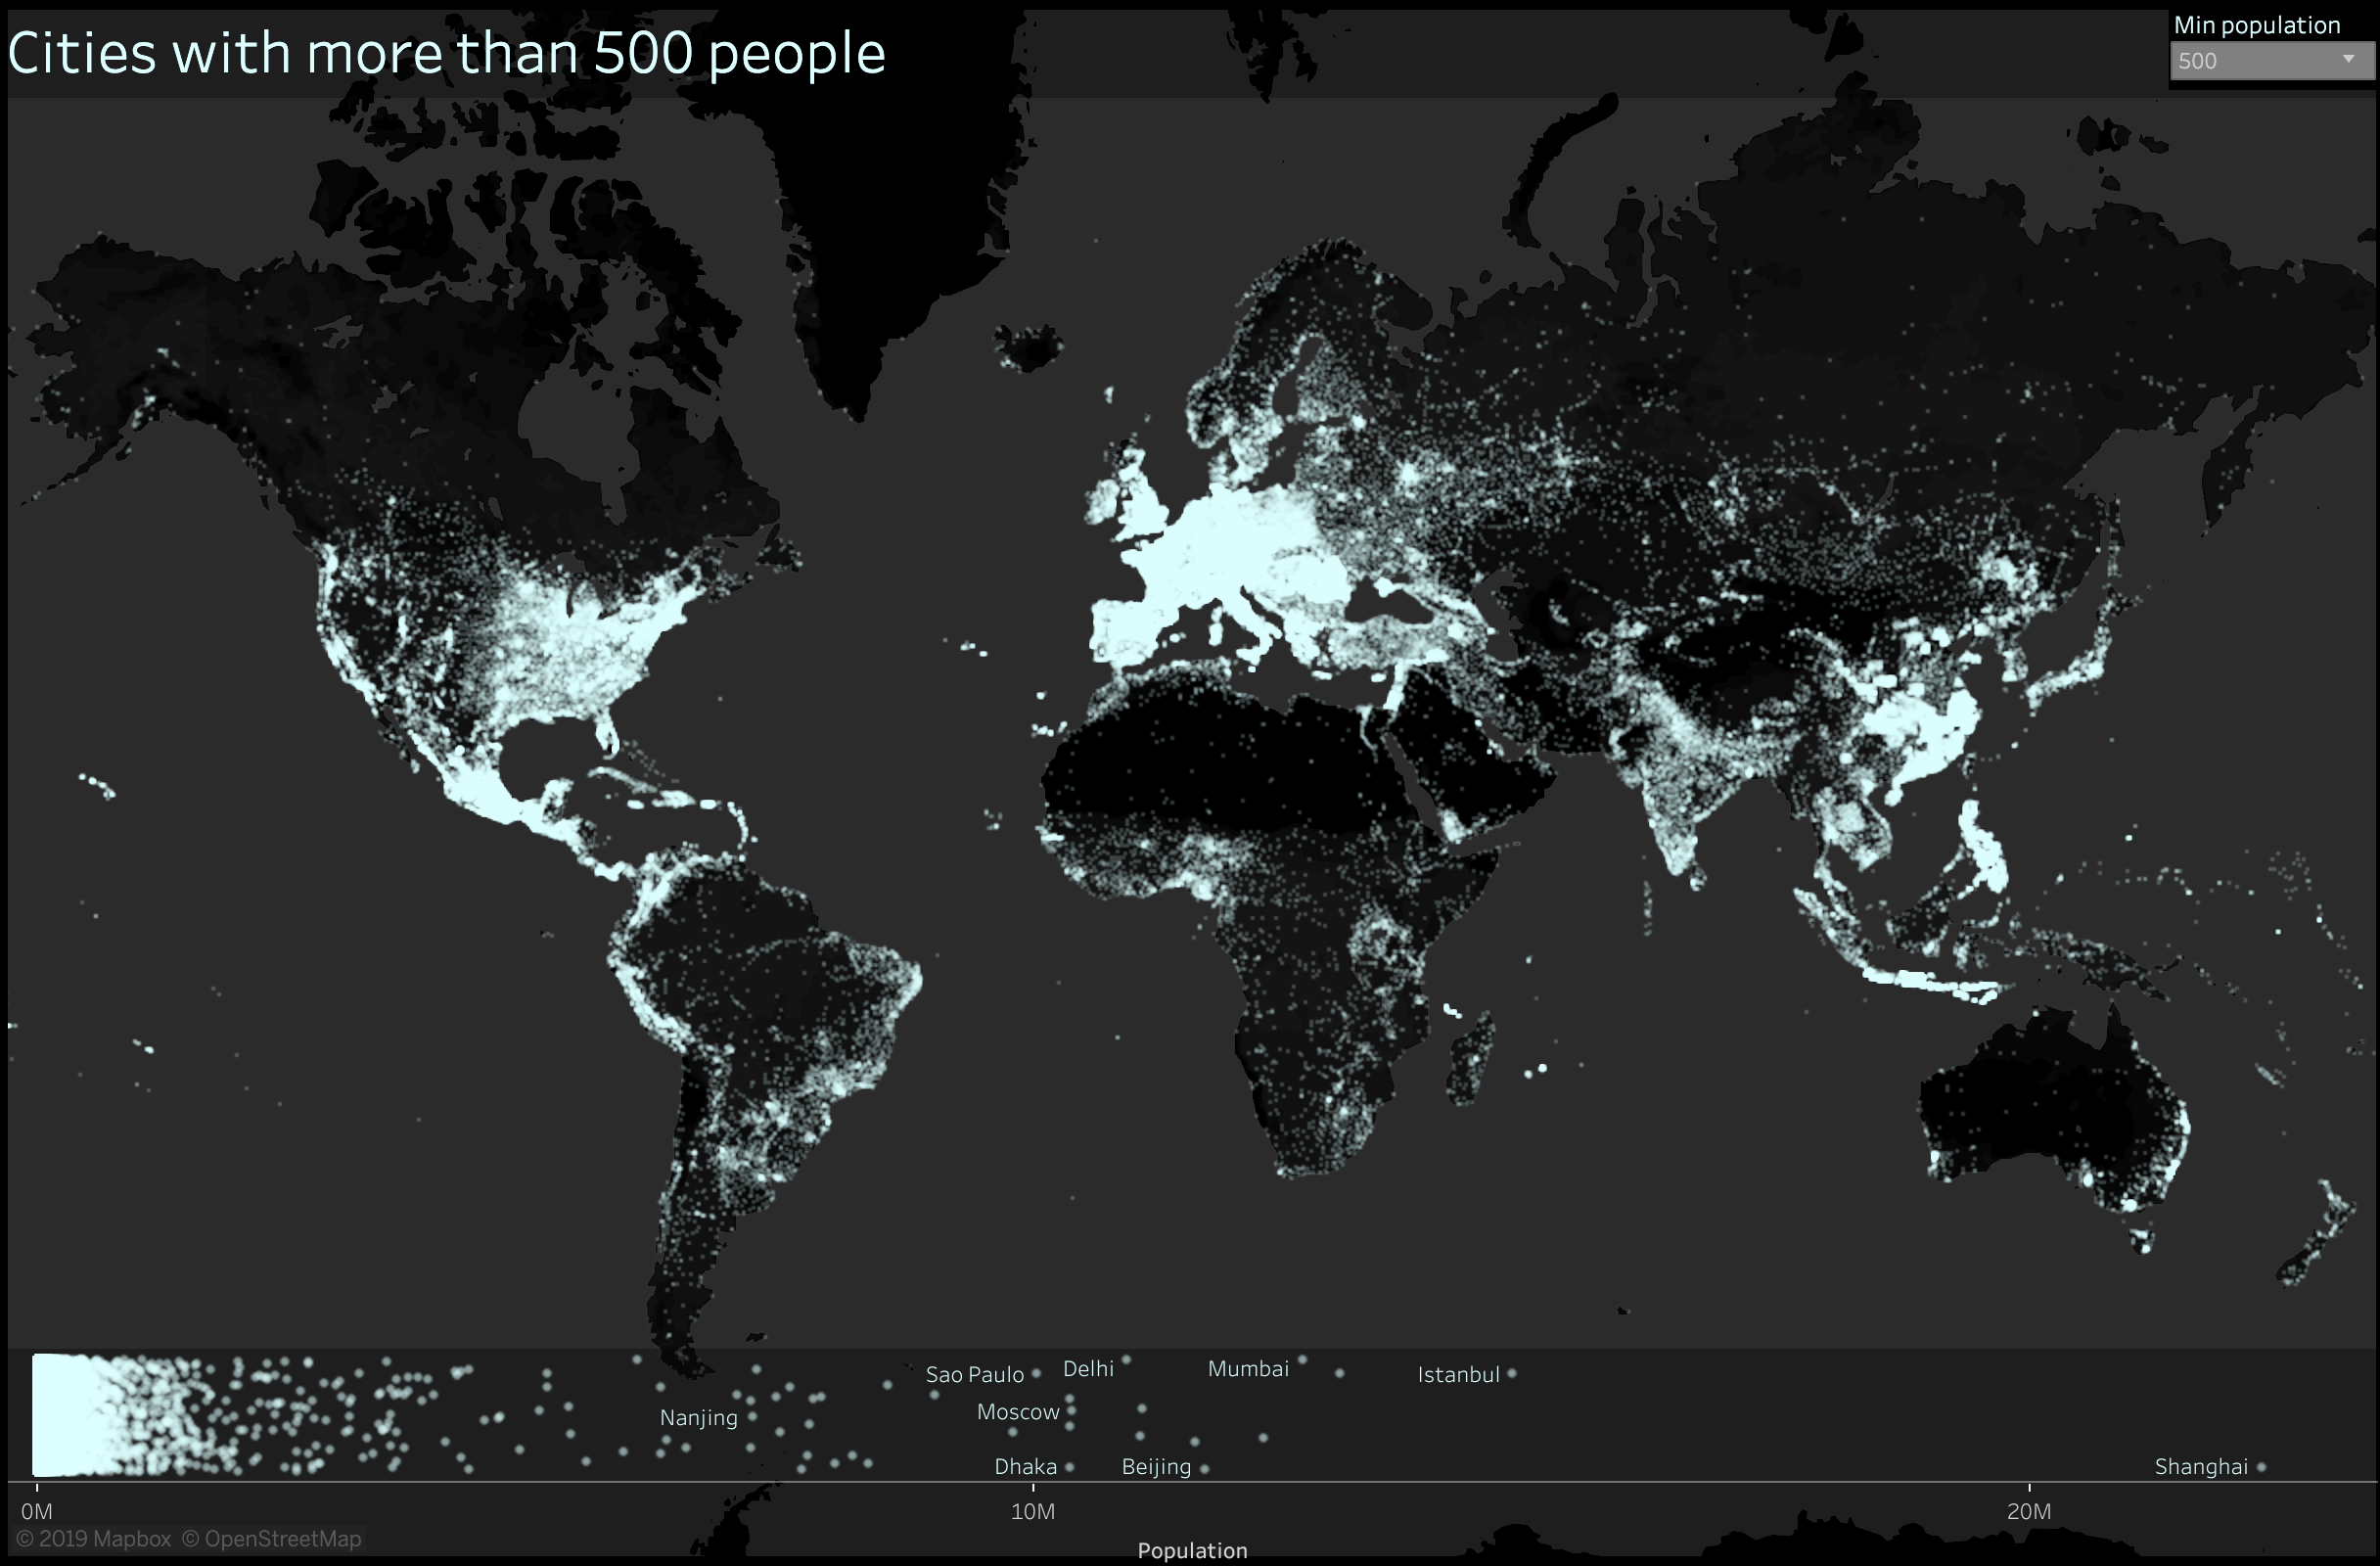
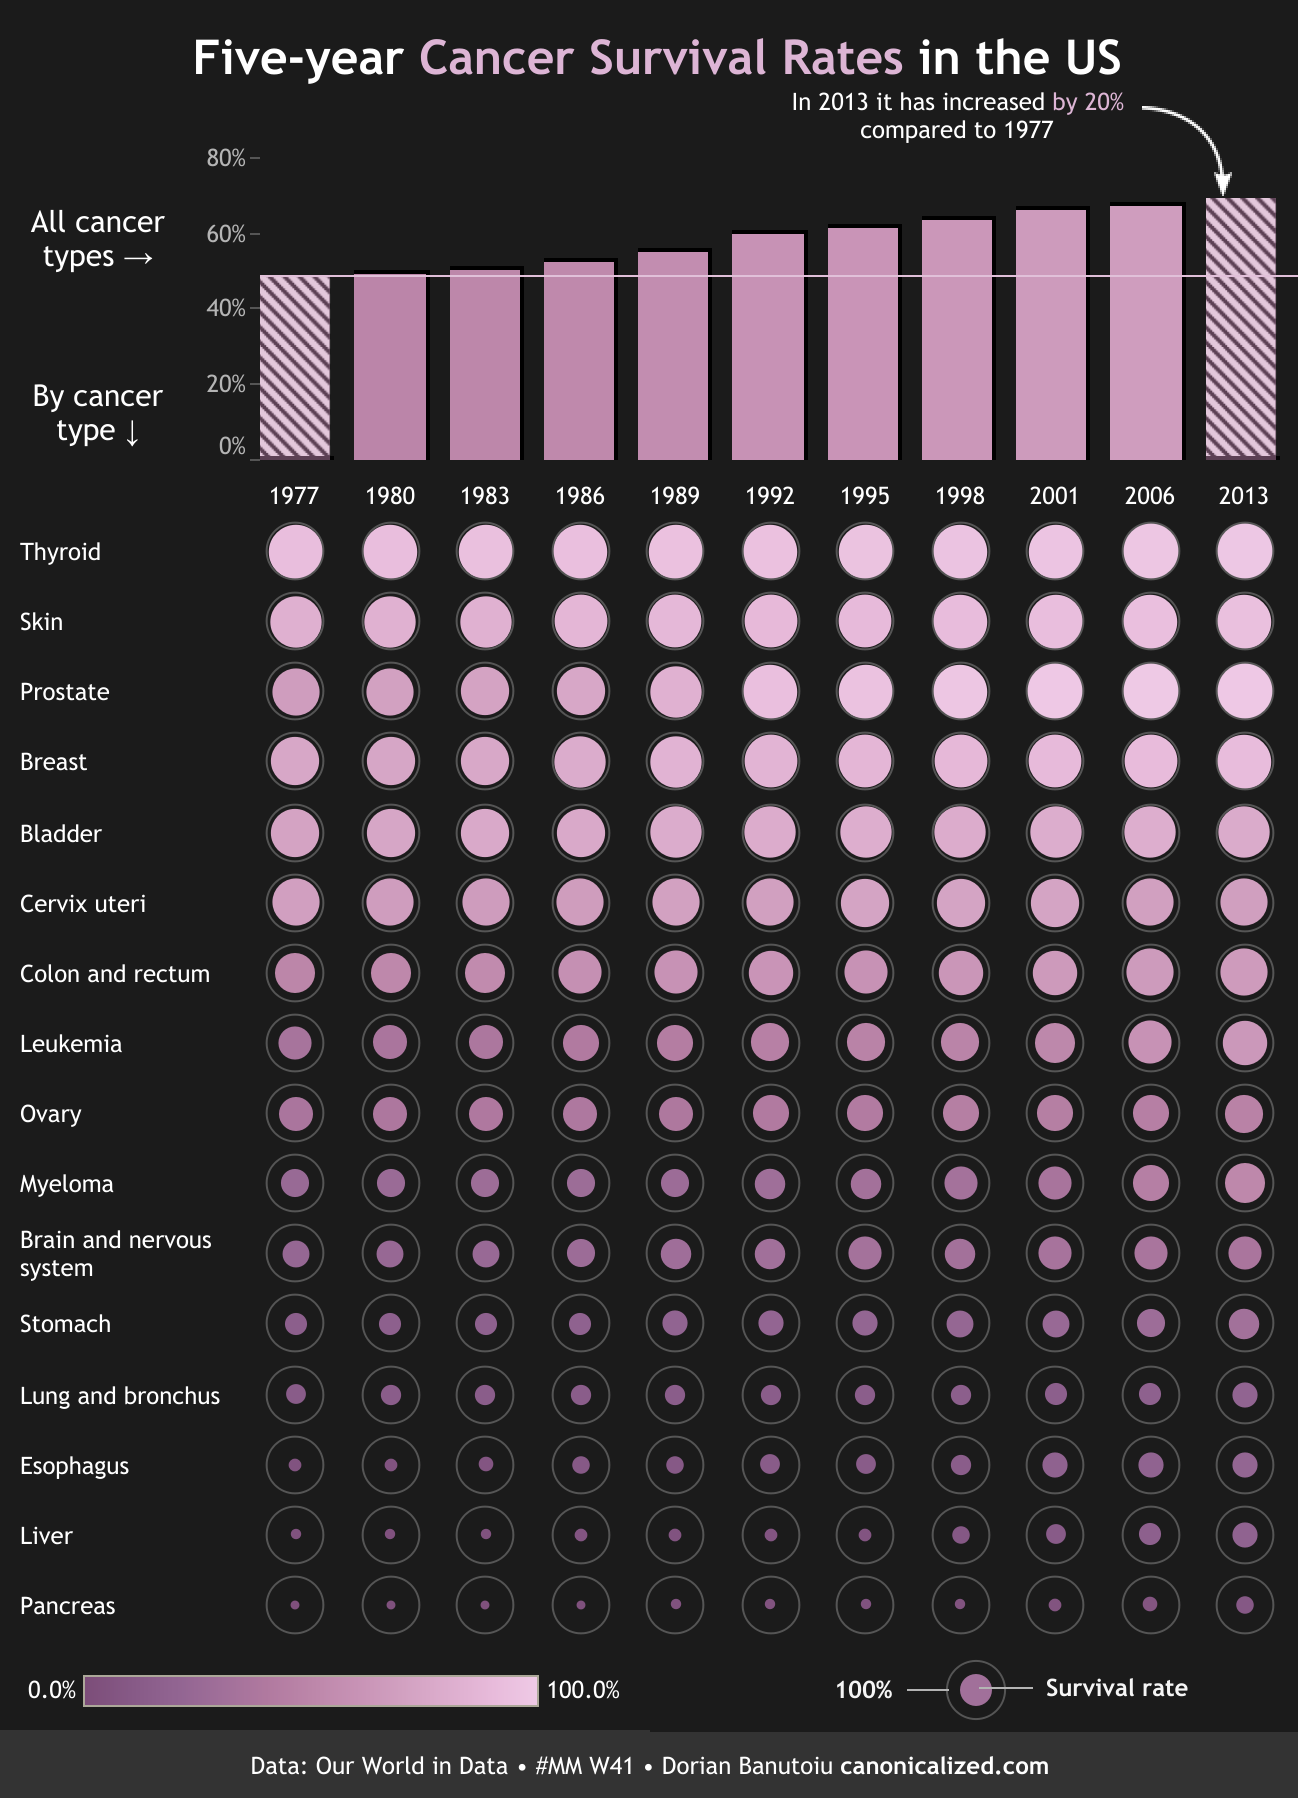
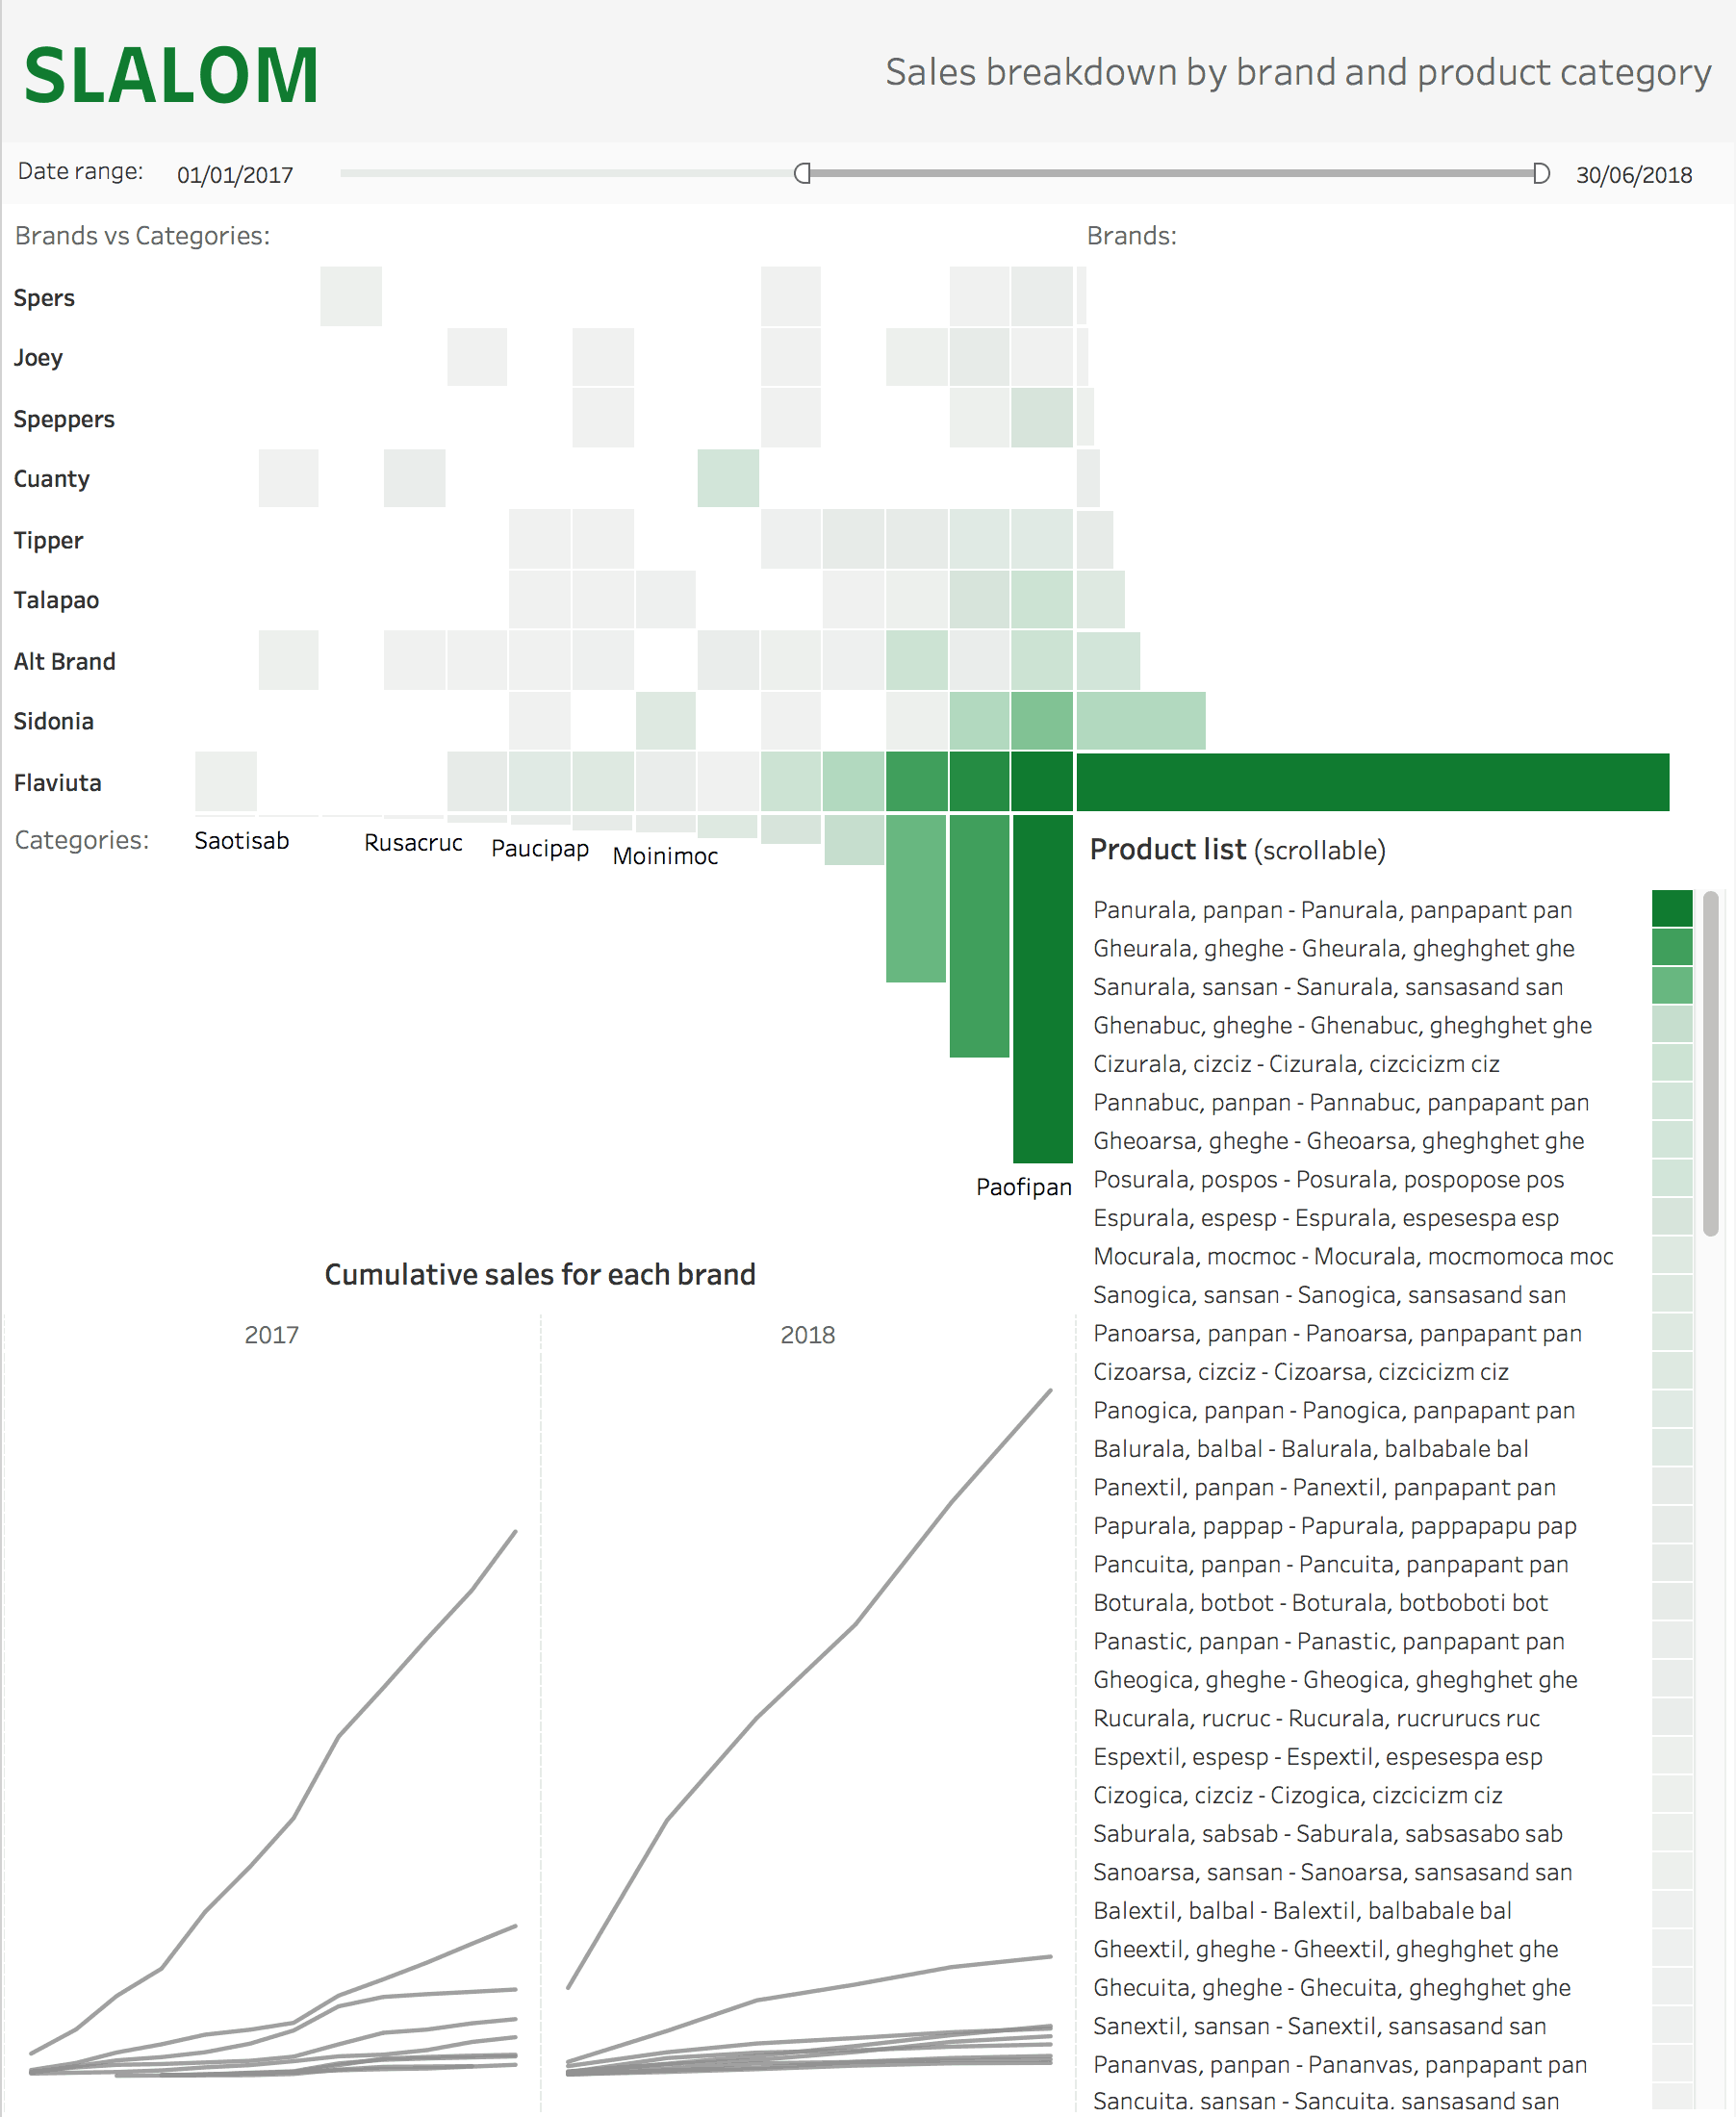

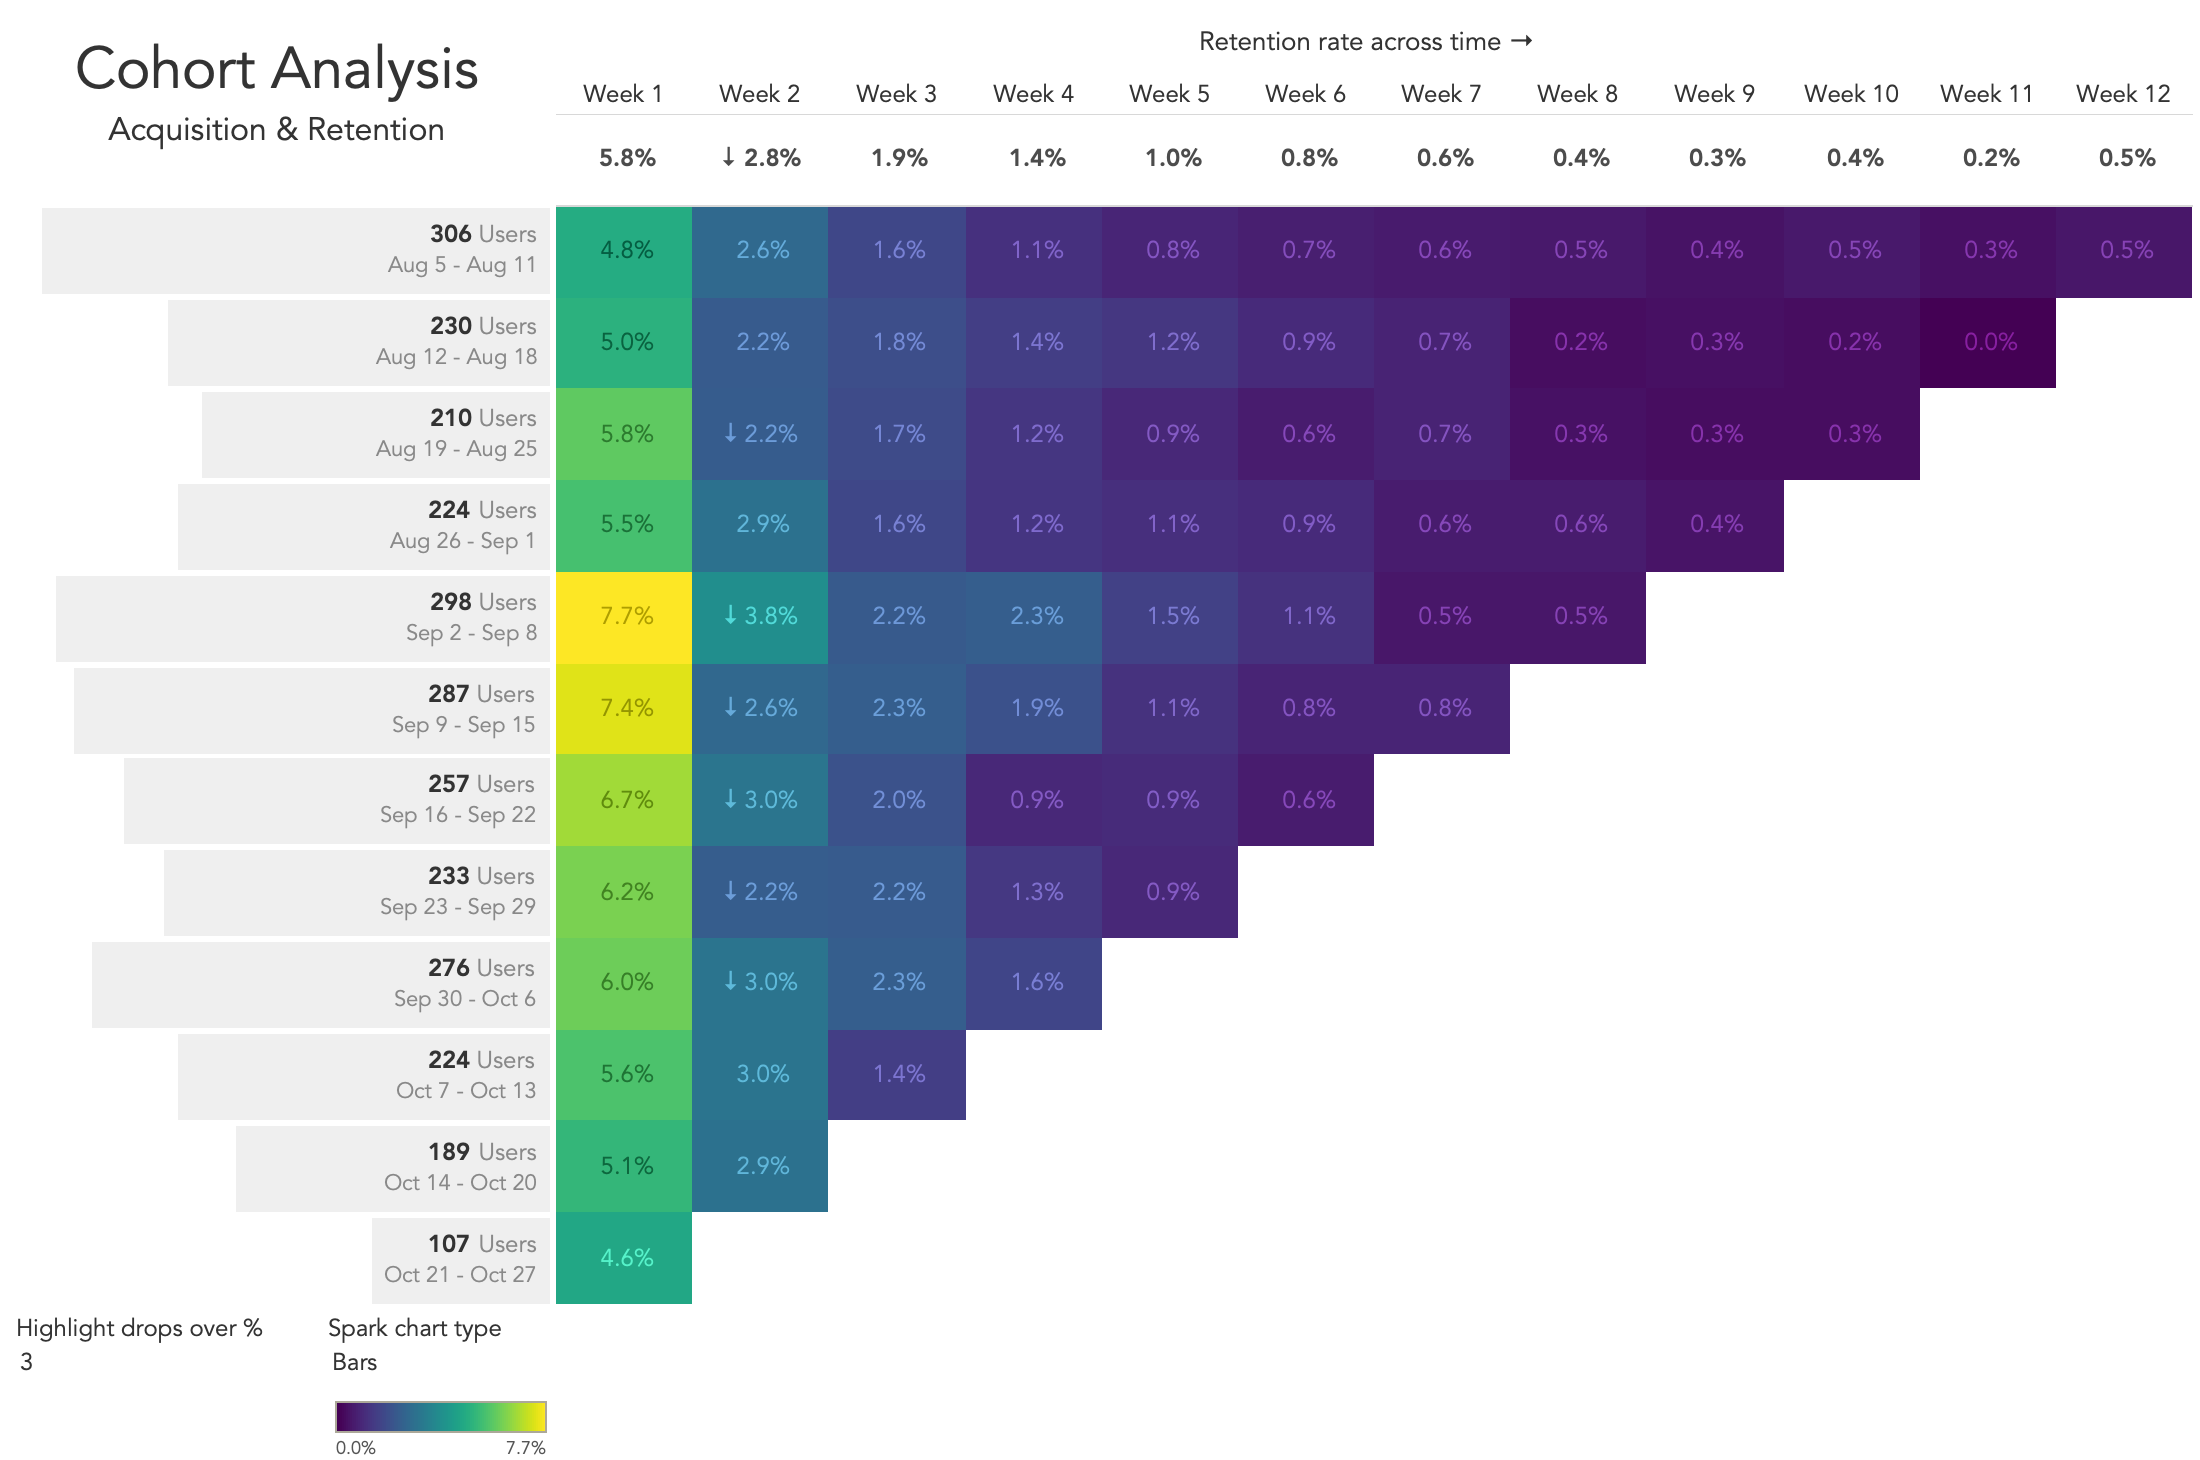
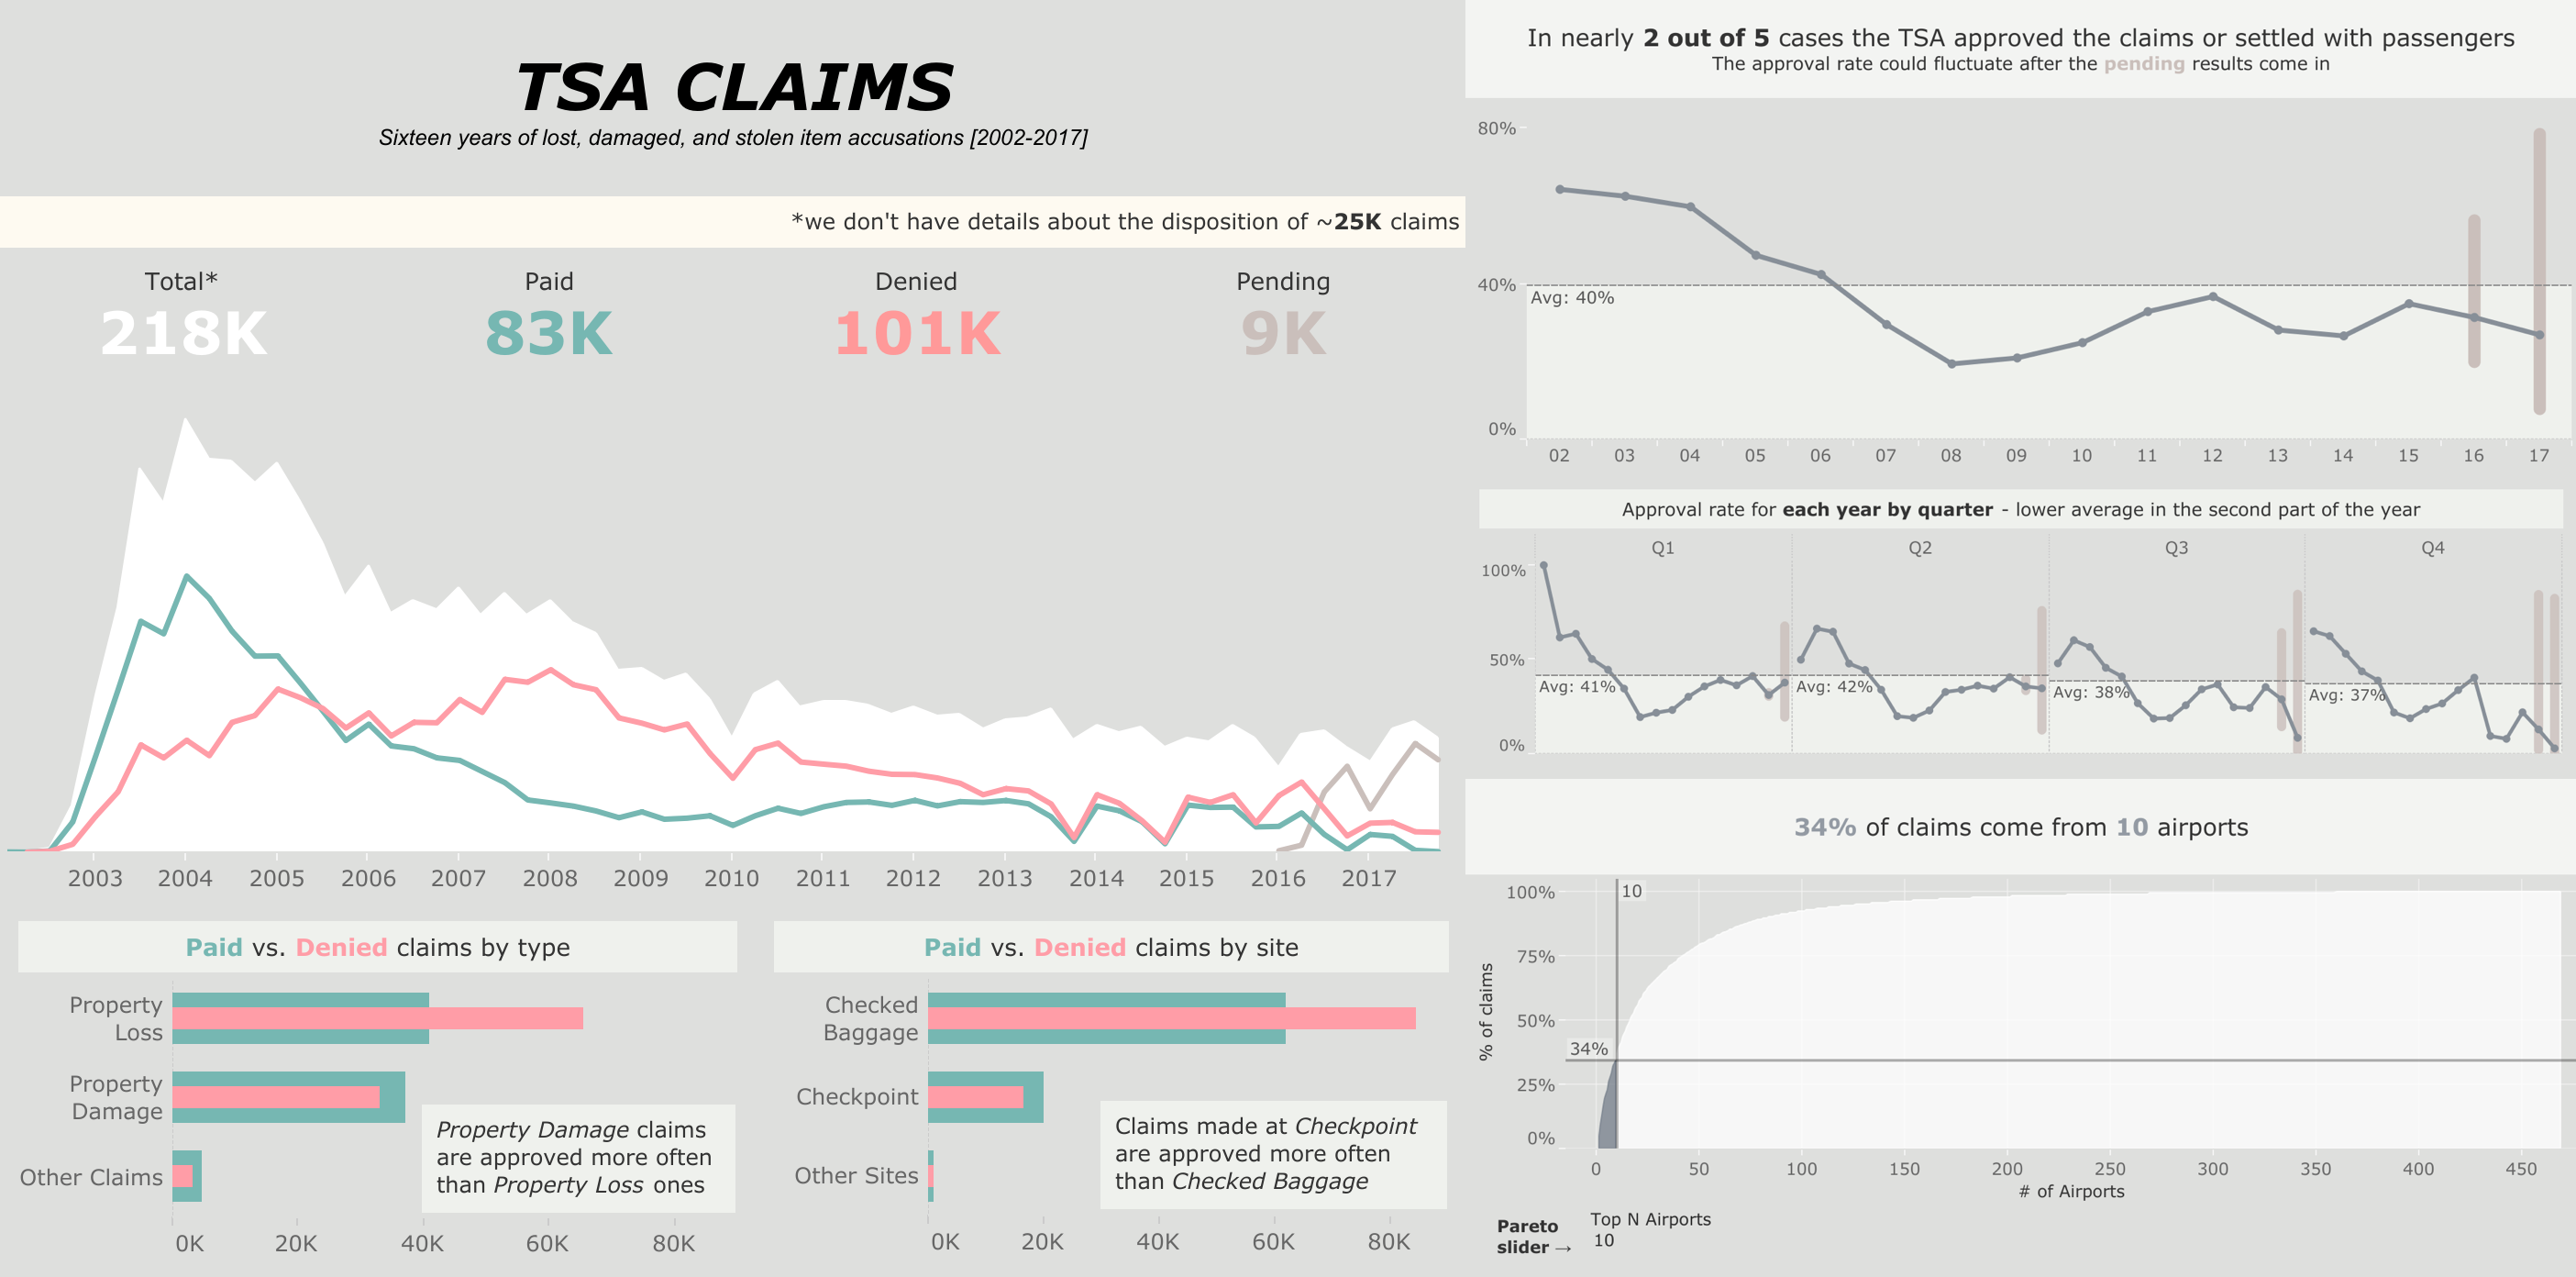
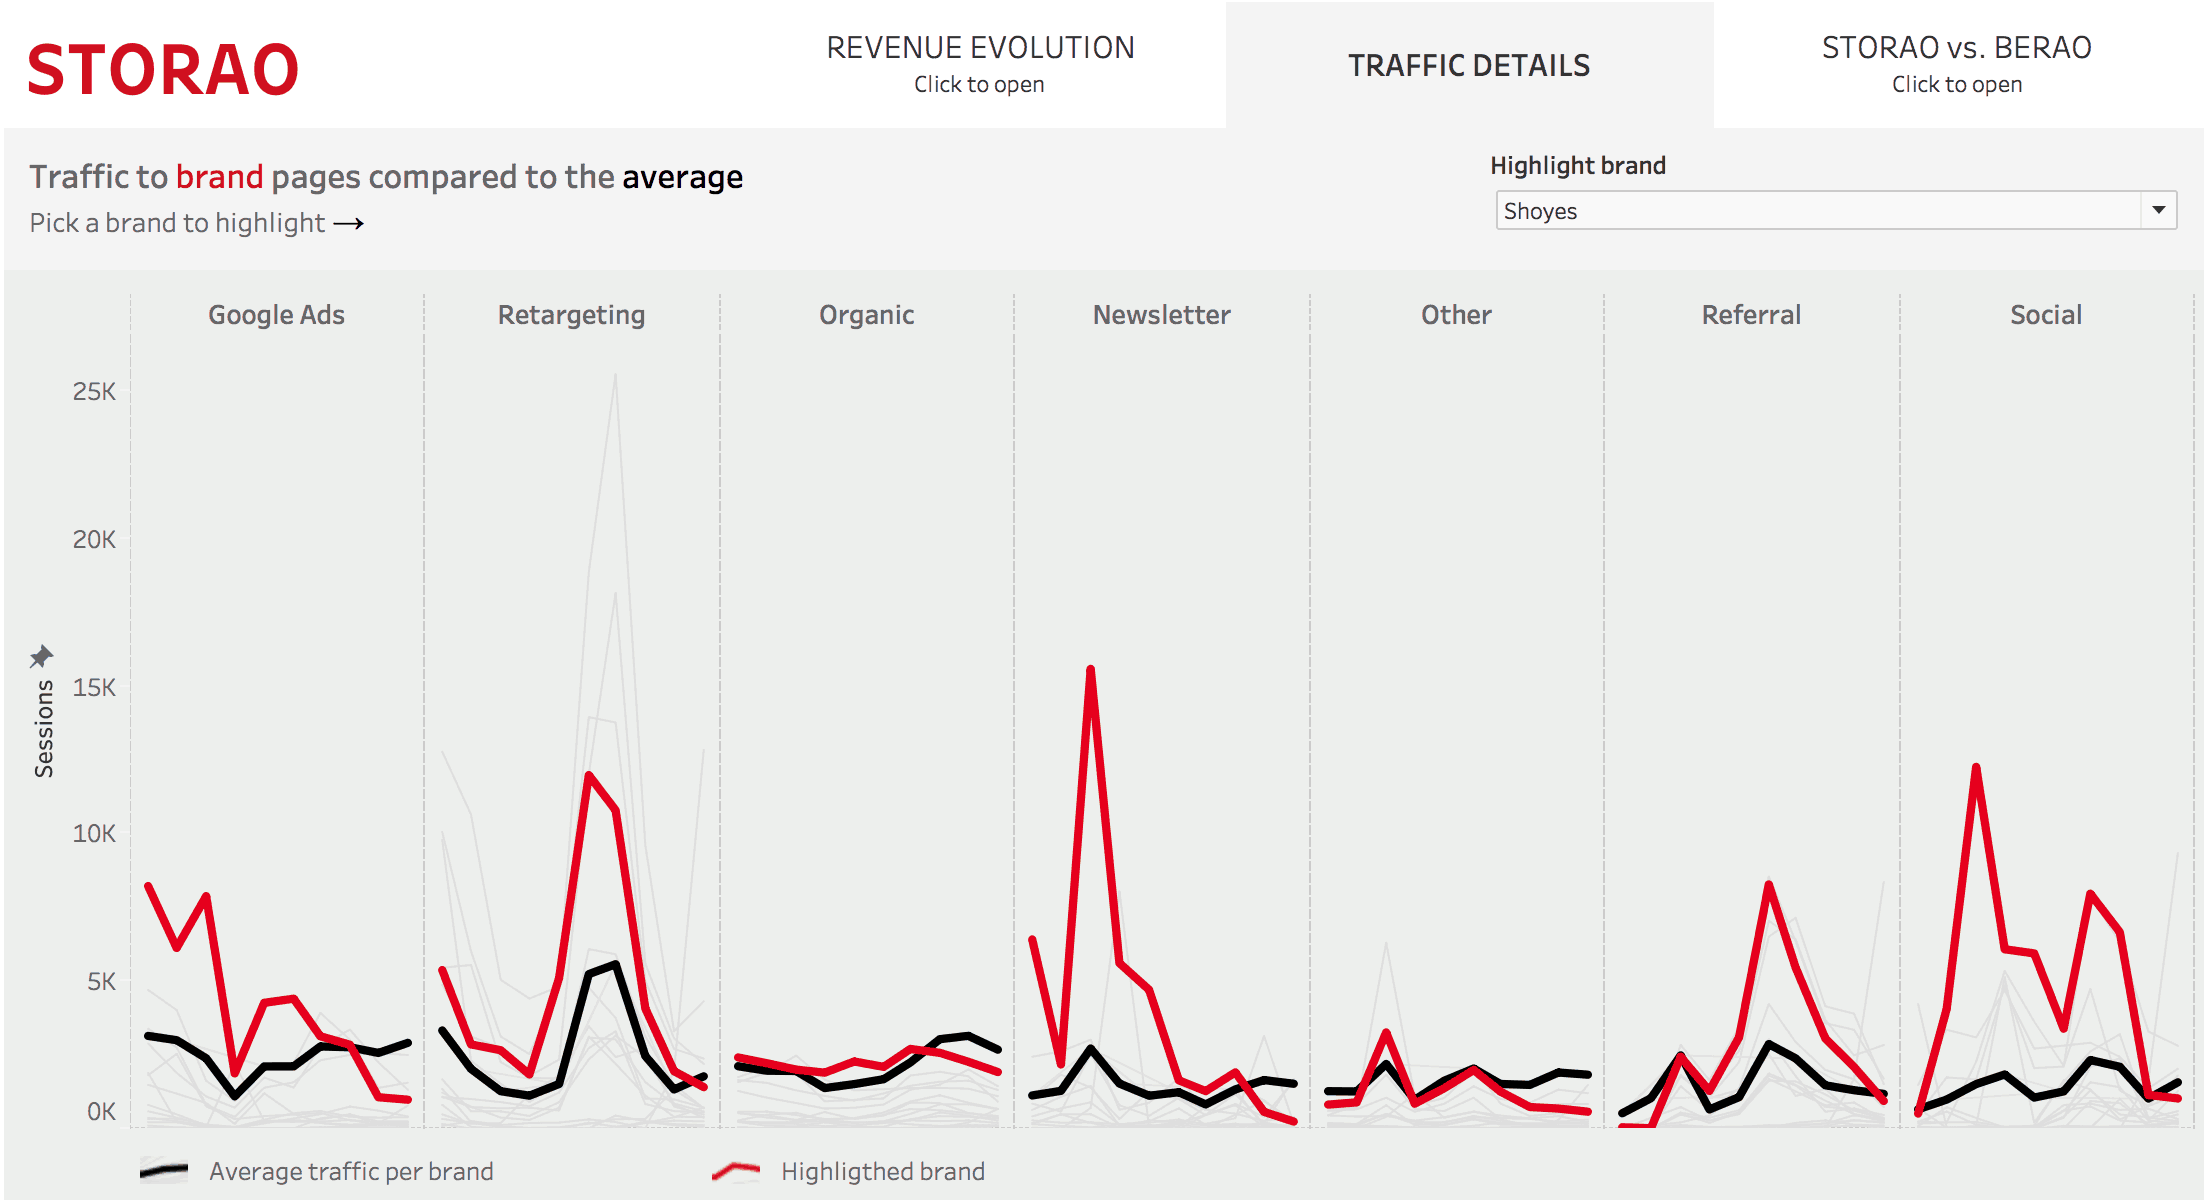
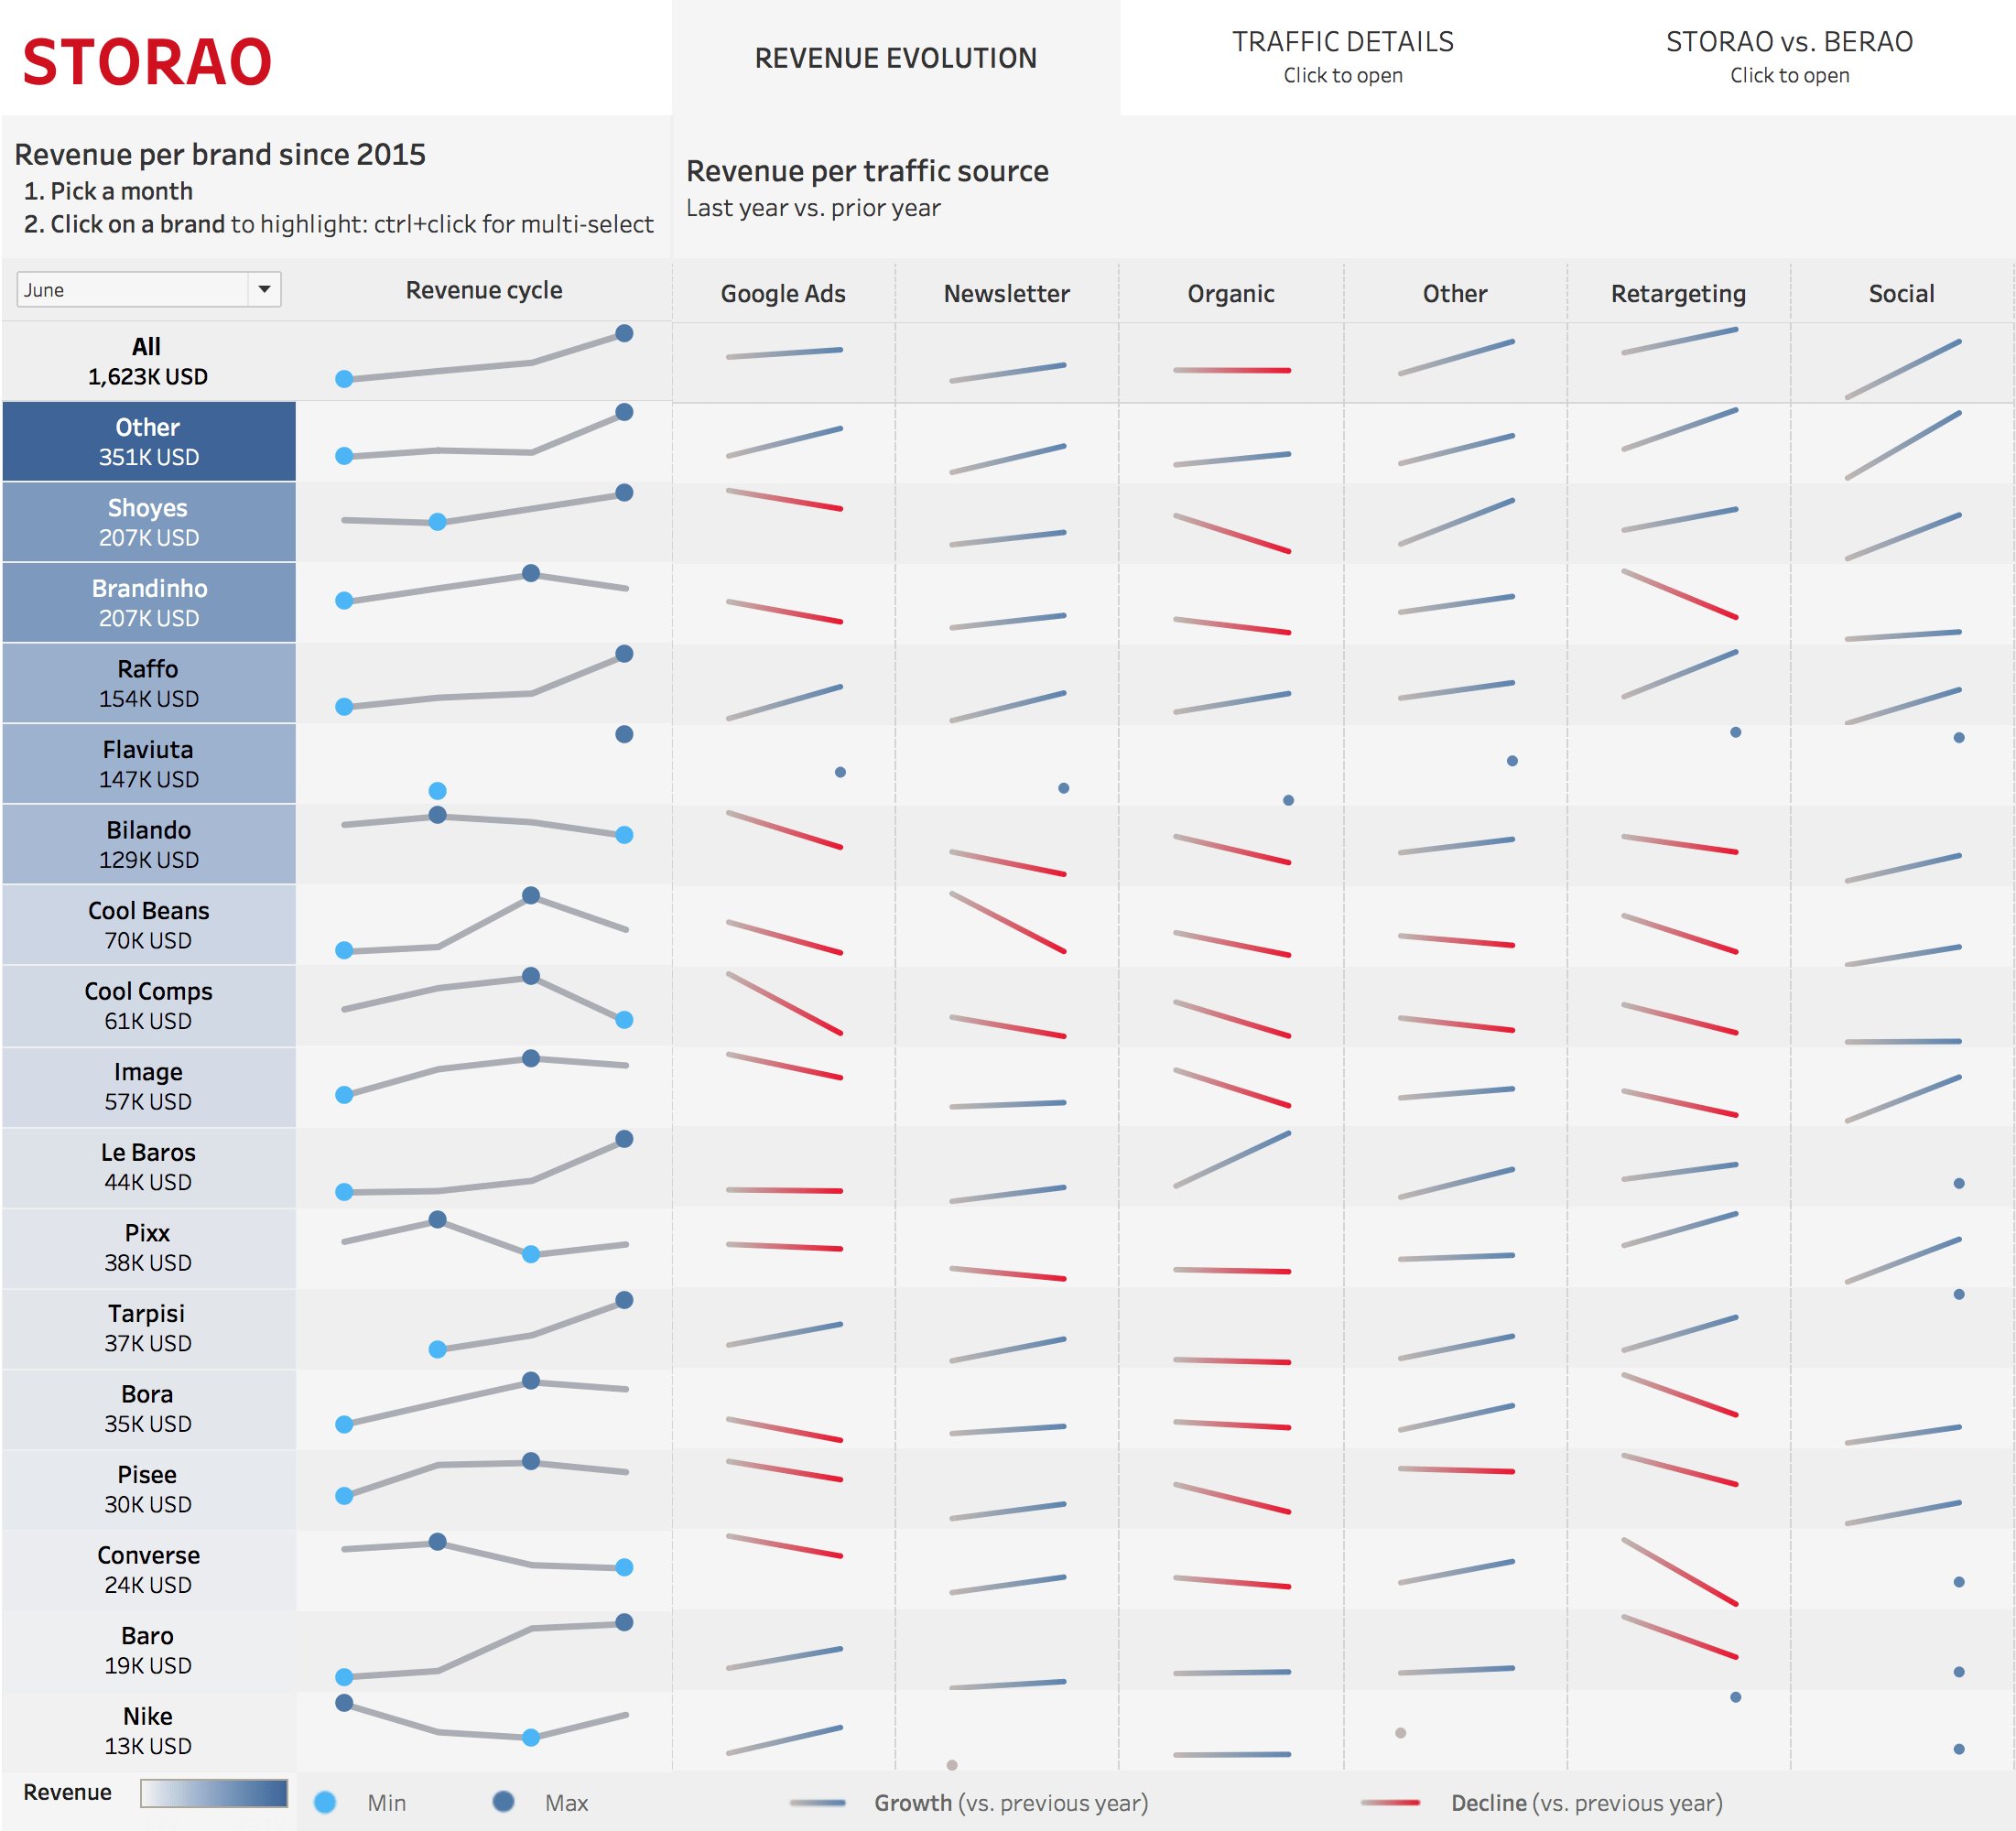
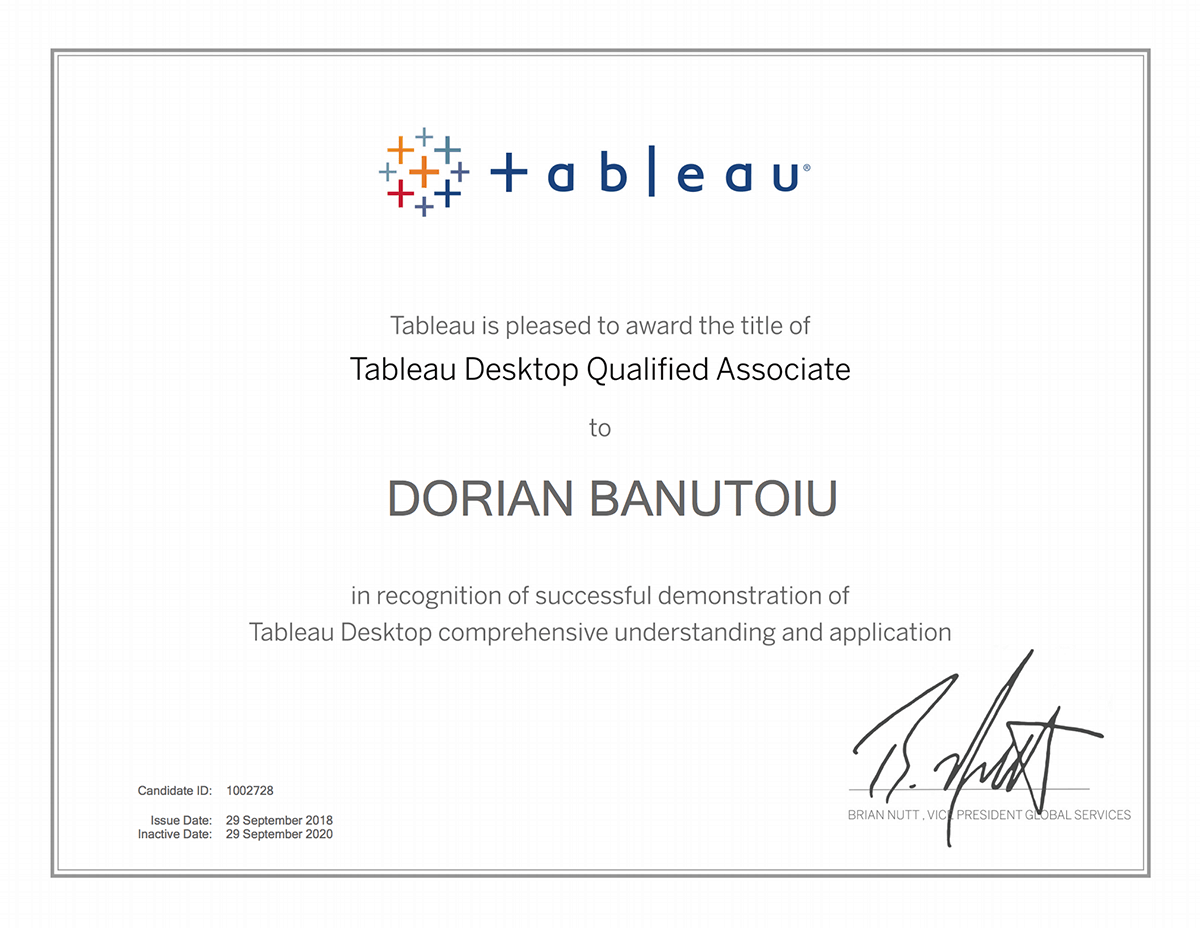
Tableau certified?
Is it a must for you to contract Tableau consulting services only from certified professionals? We are qualified!
Should you care about it? Probably not!
It’s just an acknowledgment from Tableau that we know our stuff.

