Pandas is an open-source data manipulation and analysis library for Python. It provides a wide range of tools and functions for handling and processing data, making it an essential tool for any data analyst, scientist, or engineer.
Pandas provides a fast and efficient way to work with structured data, including reading from and writing to various file formats such as CSV, Excel, and SQL databases.
The library also offers powerful data manipulation capabilities, including merging and joining datasets, grouping and aggregating data, and handling missing values.
Additionally, pandas includes convenient functions for data exploration and analysis, including descriptive statistics, and data visualization. Which can be plugged into machine learning models.
Overall, pandas is an incredibly versatile and useful library for any data analysis or manipulation task.
What is Pandas Profiling
Pandas profiling is a powerful Python library for data analysis and exploration. It provides a comprehensive report of a dataset, allowing you to quickly understand the structure and properties of your data.
The report includes a summary of the data, missing values, and a distribution of variables. It also provides insight into the relationships between variables and the correlations between them.
The profile is generated using a single line of code, making it an easy and efficient way to perform exploratory data analysis.
The benefits of using pandas profiling for data analysis include time-saving, efficient exploratory data analysis, and the ability to uncover hidden patterns and relationships in the data.
In this blog post, we will take a closer look at the use of pandas profiling in real-world data analysis projects.
But first, let’s see how we can get started with the package.
Installation
To use pandas profiling, you need to have the pandas and pandas-profiling libraries installed. You can install them using pip or conda.
Assuming you already have pandas installed, here’s how you can add the pandas-profiling package:
Using pippip install pandas-profiling
Using condaconda install -c conda-forge pandas-profiling
Loading Data
The first step in using pandas profiling is to load your data into a pandas DataFrame.
You can do this by using the pandas.read_csv function or any other similar function for loading data from other file formats. For example:
import pandas as pd
df = pd.read_csv(‘customer_data.csv’)
Generating a Report
Once your data is loaded into a DataFrame, you can generate a pandas profiling report by calling the pandas_profiling.ProfileReport class and passing in your DataFrame as an argument.
For example:
import pandas_profiling
pandas_profiling.ProfileReport(df)
Depending on the size of the data, you should have a comprehensive data profile in little to no time.
Viewing the Report
The easiest way to see the report is to run the ProfileReport in either a Jupyter Notebook, Google Colab or the coding IDE of your choice like VSCode, Pycharm, etc.
This will display the pandas profiling report, which provides a comprehensive summary of your data, including descriptive statistics, correlations, missing values, and more.
The report also includes various interactive widgets and plots that allow you to easily explore and analyze your data.
There is also the option of deploying it in a streamlit app with the help of the streamlit-pandas-profiling library.
Customizing the Report
You can customize the generated report by passing additional arguments to the ProfileReport class.
For example, you can specify the variables to include or exclude, set the minimal correlation, set the sample size, and more. For a full list of available options, please refer to the pandas profiling documentation.
Pandas profiling is a convenient and efficient tool for exploring and analyzing small to medium datasets.
By following the steps outlined in this section, you can easily generate a comprehensive report for your data, saving you time and effort compared to manually exploring and analyzing your data.
Real-world use case examples of pandas profiling
In this section, we will explore three real-world use case examples of pandas profiling. These examples will demonstrate the power of pandas profiling in uncovering key insights in real-world data analysis projects.
Use case 1: Exploring customer data for a retail company
Problem statement
A retail company wants to understand their customer data better. They have data on customers’ age, gender, location, and purchase history.
They want to use this data to gain insights into their customer base and make informed decisions about their business.
Data analysis using pandas profiling
The customer data is loaded into a pandas dataframe and a pandas profiling report is generated.
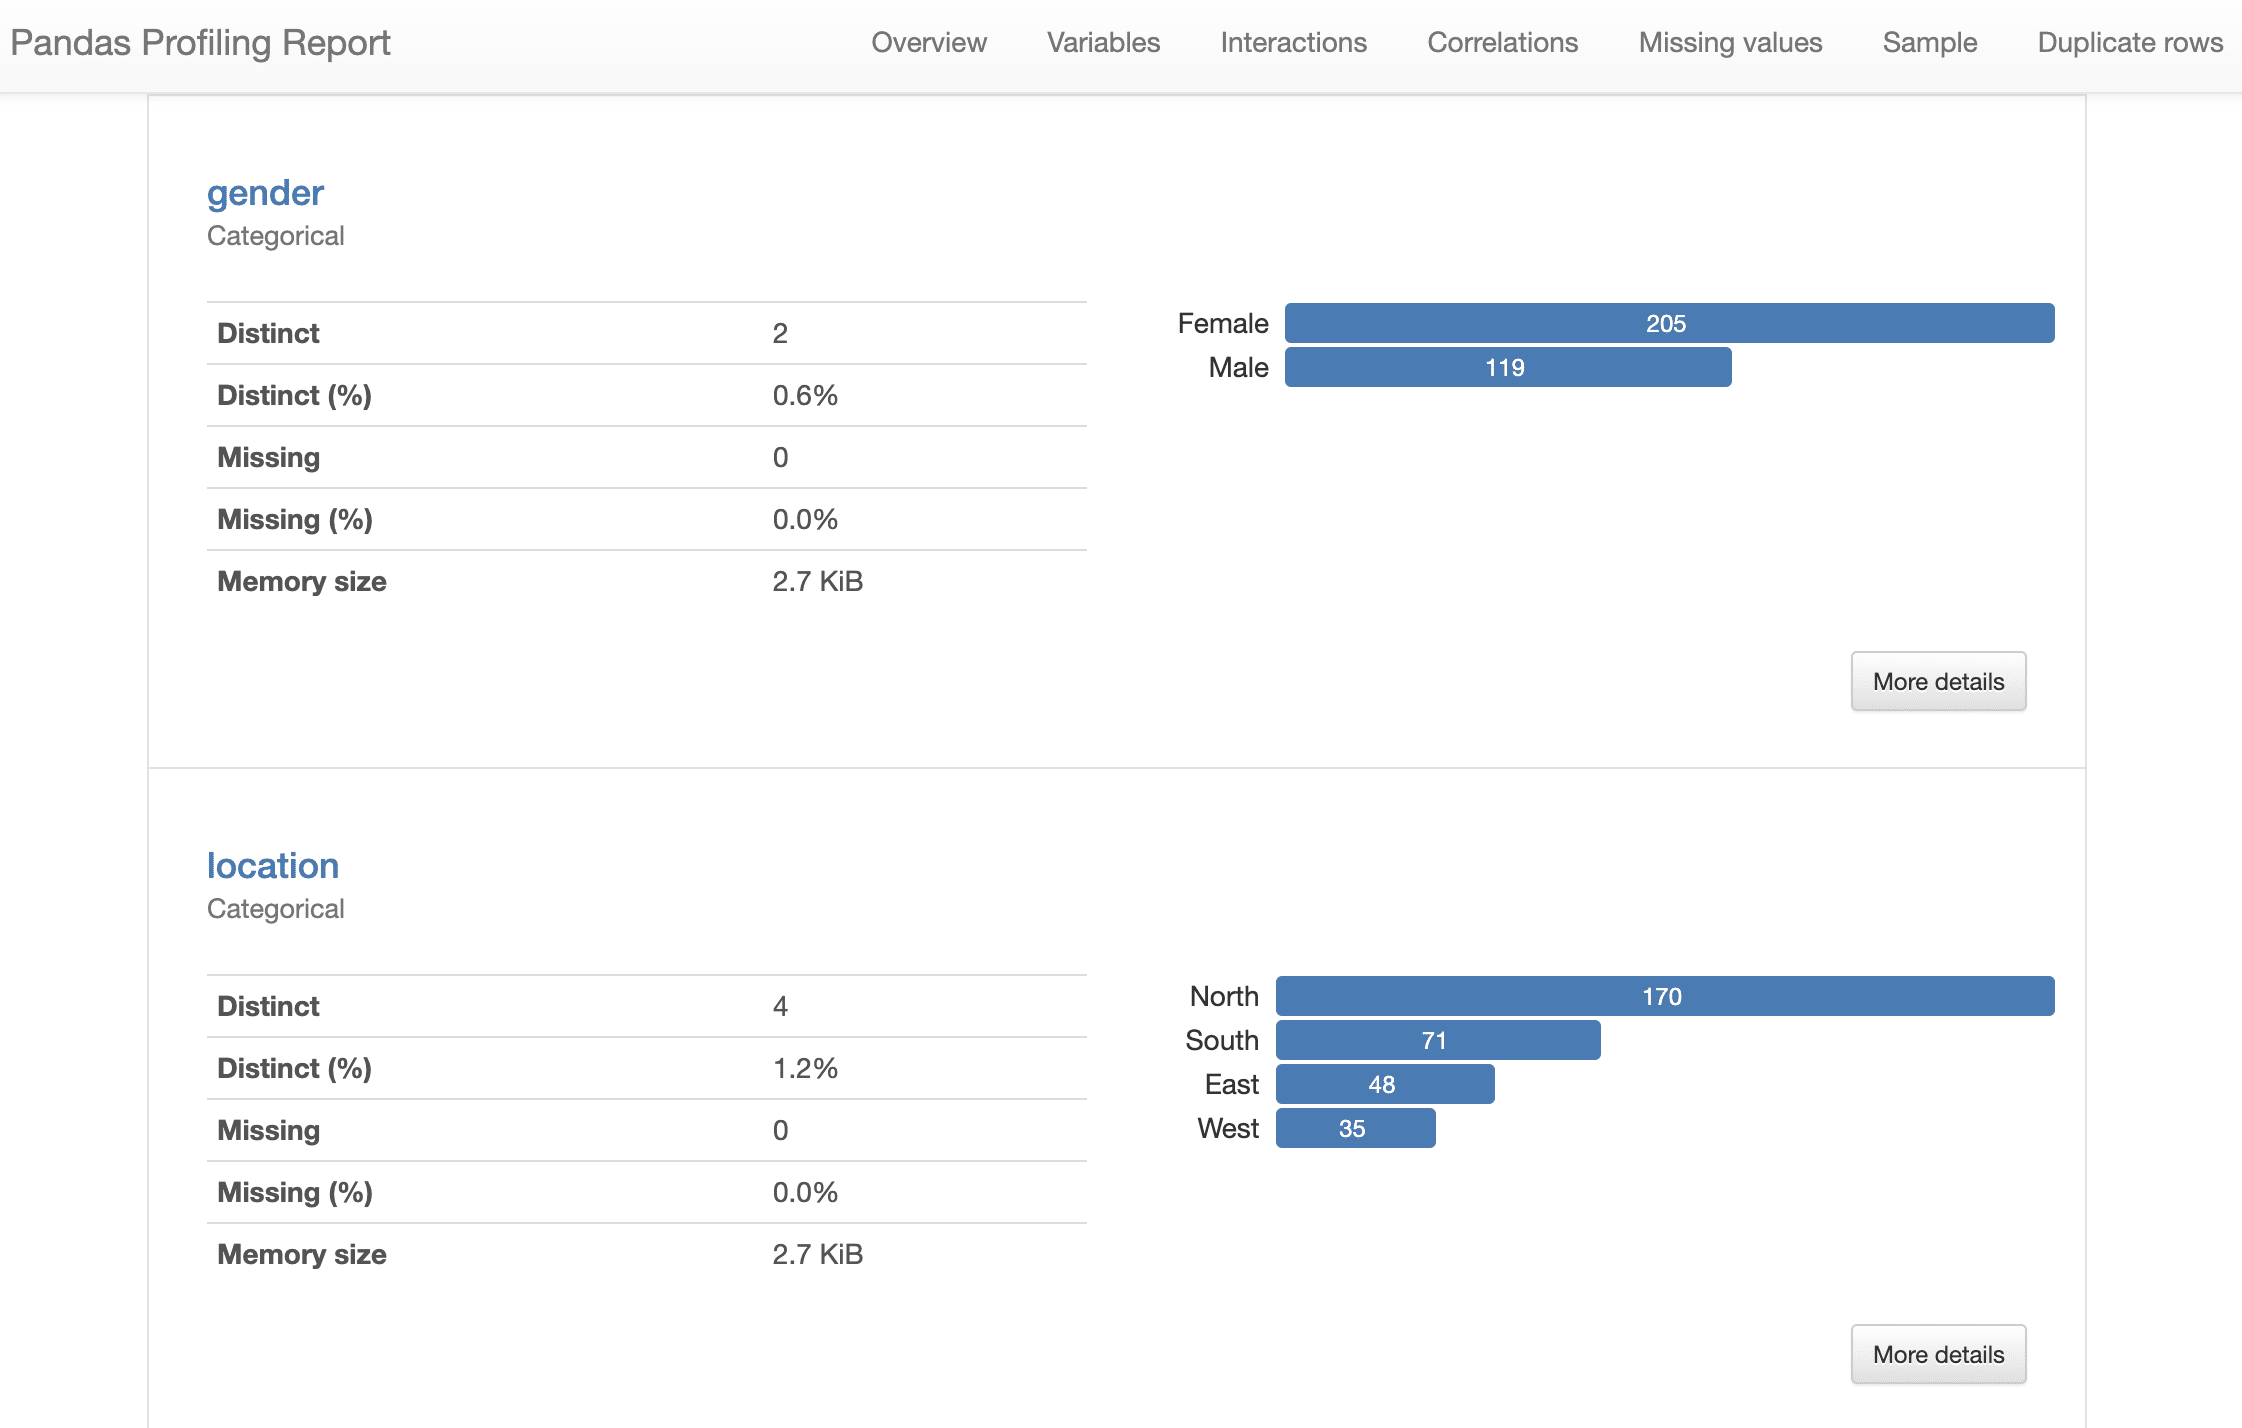
The report provides a summary of the data, including the number of missing values and the distribution of variables.
It also highlights the relationships between variables and the correlations between them.
Key insights derived from the pandas profiling report
The pandas profiling report reveals that the majority of customers are female and are located in the same region.
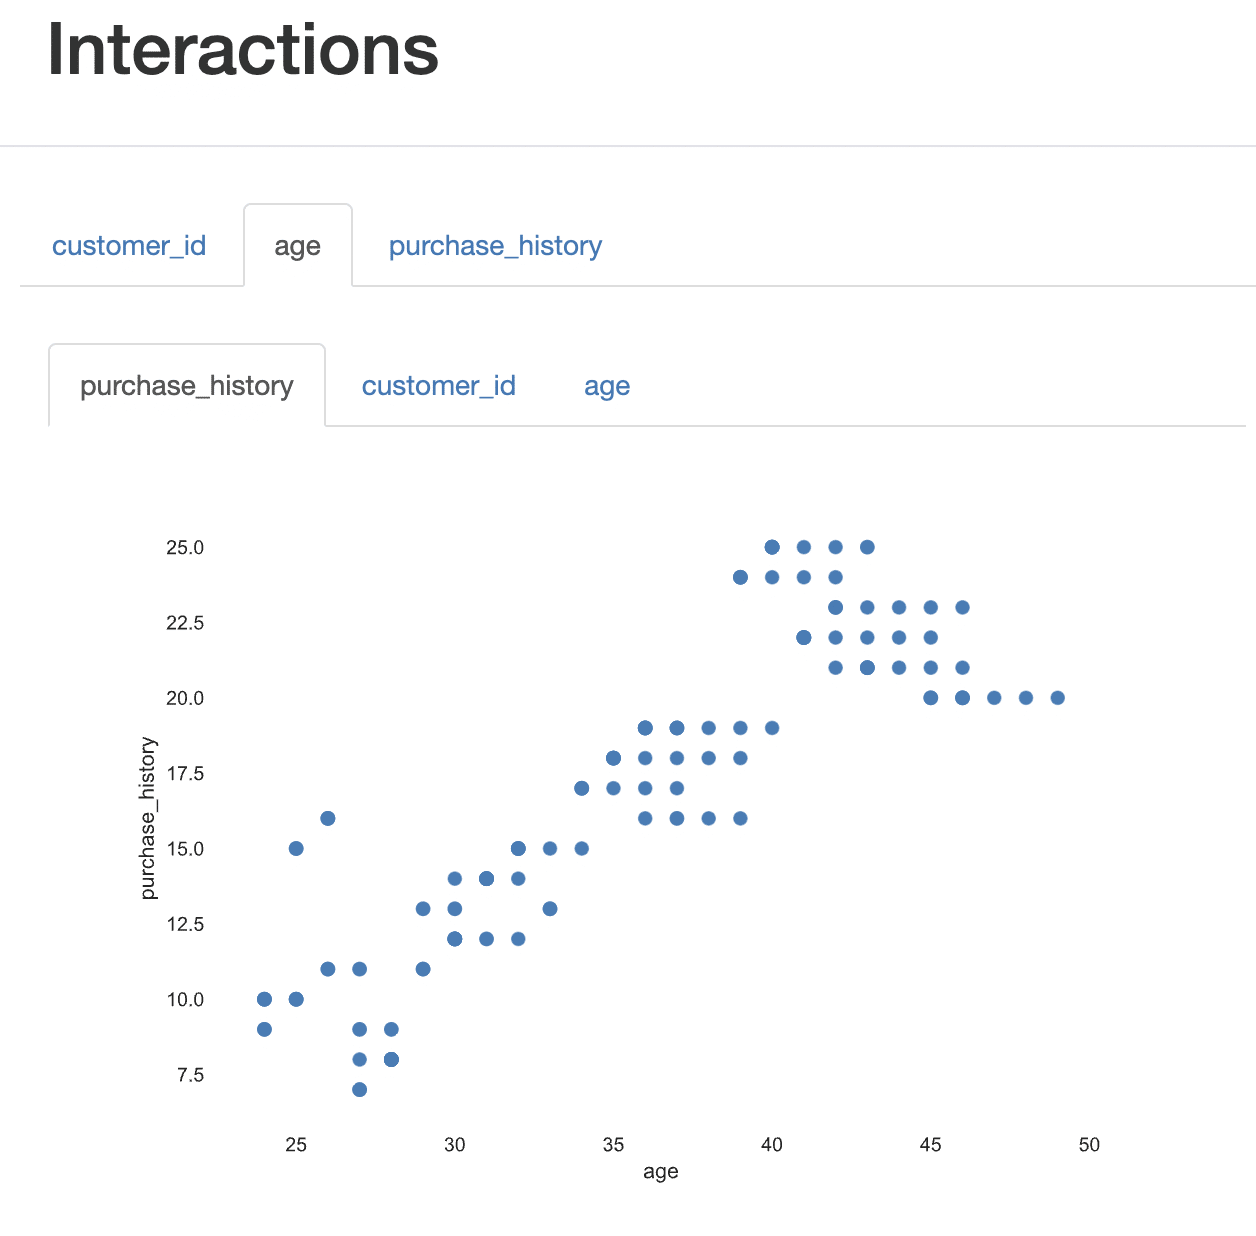
It also shows that there is a strong correlation between age and purchase history, with older customers making more purchases.
Use case 2: Analyzing employee data for a tech company
Problem statement
A tech company wants to understand their employee data better. They have data on employee demographics, job title, and salary. They want to use this data to gain insights into their employee base and make informed decisions about their human resources.
Data analysis using pandas profiling
The employee data is loaded into a pandas dataframe and a pandas profiling report is generated.
The report provides a summary of the data, including the number of missing values and the distribution of variables. It also highlights the relationships between variables and the correlations between them.
Key insights derived from the pandas profiling report
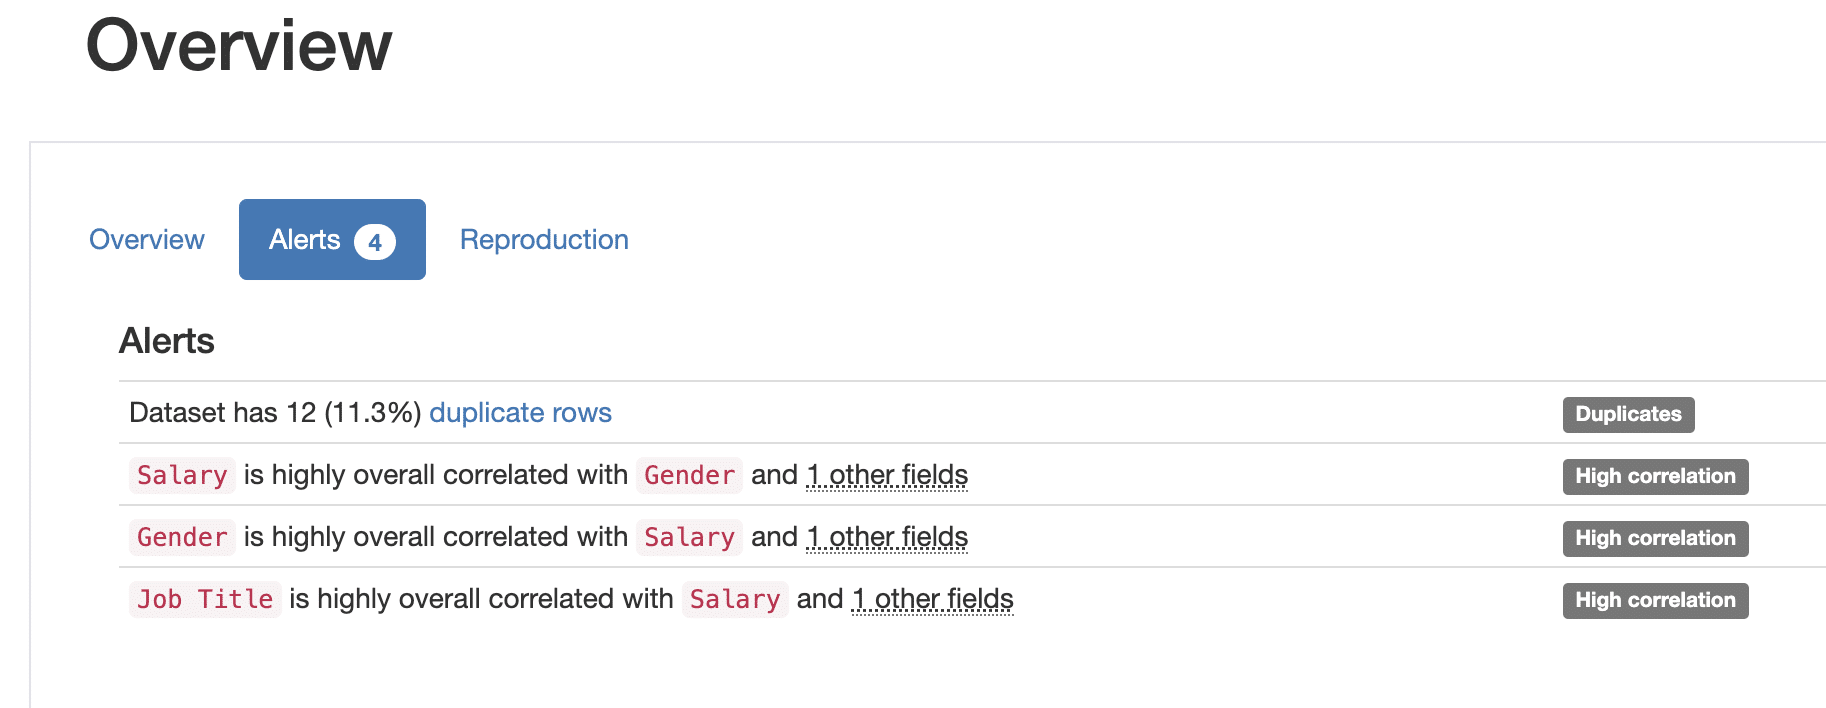
The pandas profiling report reveals that the majority of employees are male and have a high salary. It also shows that there is a strong correlation between job title and salary, with higher job titles having a higher salary.
The Alerts in the Overview tab point to correlations between Gender and Job title to salaries.
The correlation matrix points to this as well.
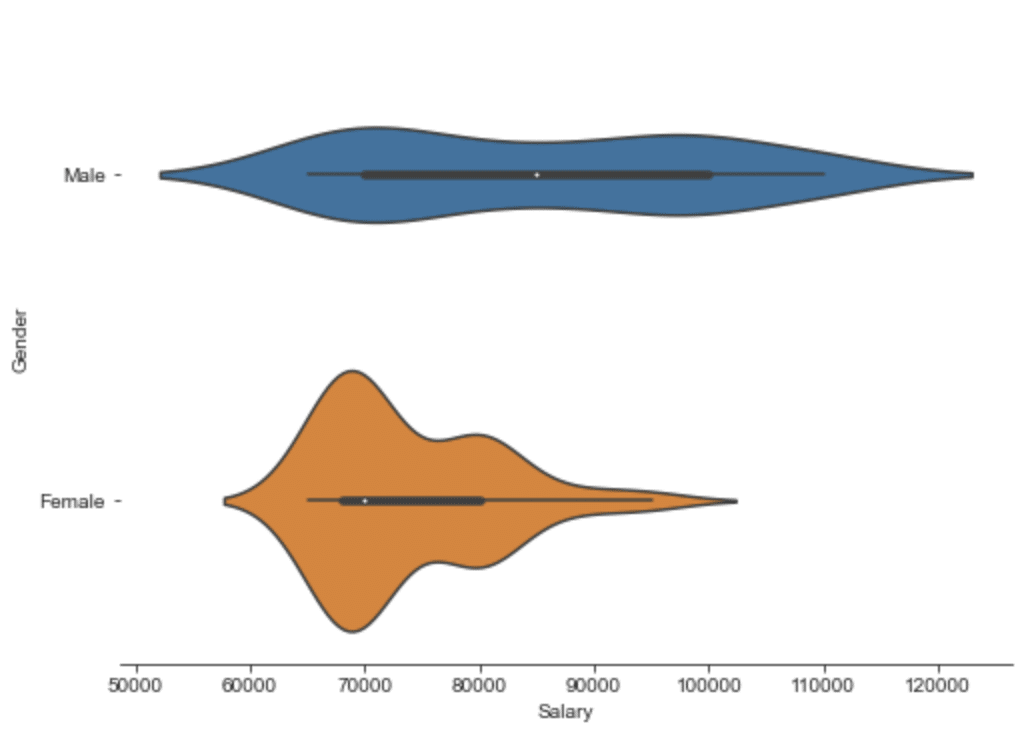
Pandas profiling doesn’t show a relationship between categorical (Job title, Gender) and numeric ones (Salary).
So I created a couple of violin plots to compare the Salary distributions. First by gender:
The code I used to create this plot is based on the seaborn library (df is the Pandas data frame which holds our data):
%matplotlib inline

import seaborn as sns
import matplotlib.pyplot as plt

# Create a violin plot using seaborn
sns.set_style("ticks")
fig, ax = plt.subplots(figsize=(8, 6))
sns.violinplot(x='Salary', y='Gender', data=df)

# Remove the grid lines
sns.despine(left=True)


# Show the plot
plt.show()
By looking at the chart we can see that males reach higher salaries.
To make sure it isn’t a case of Simpson’s paradox I also split the distributions by Job title:
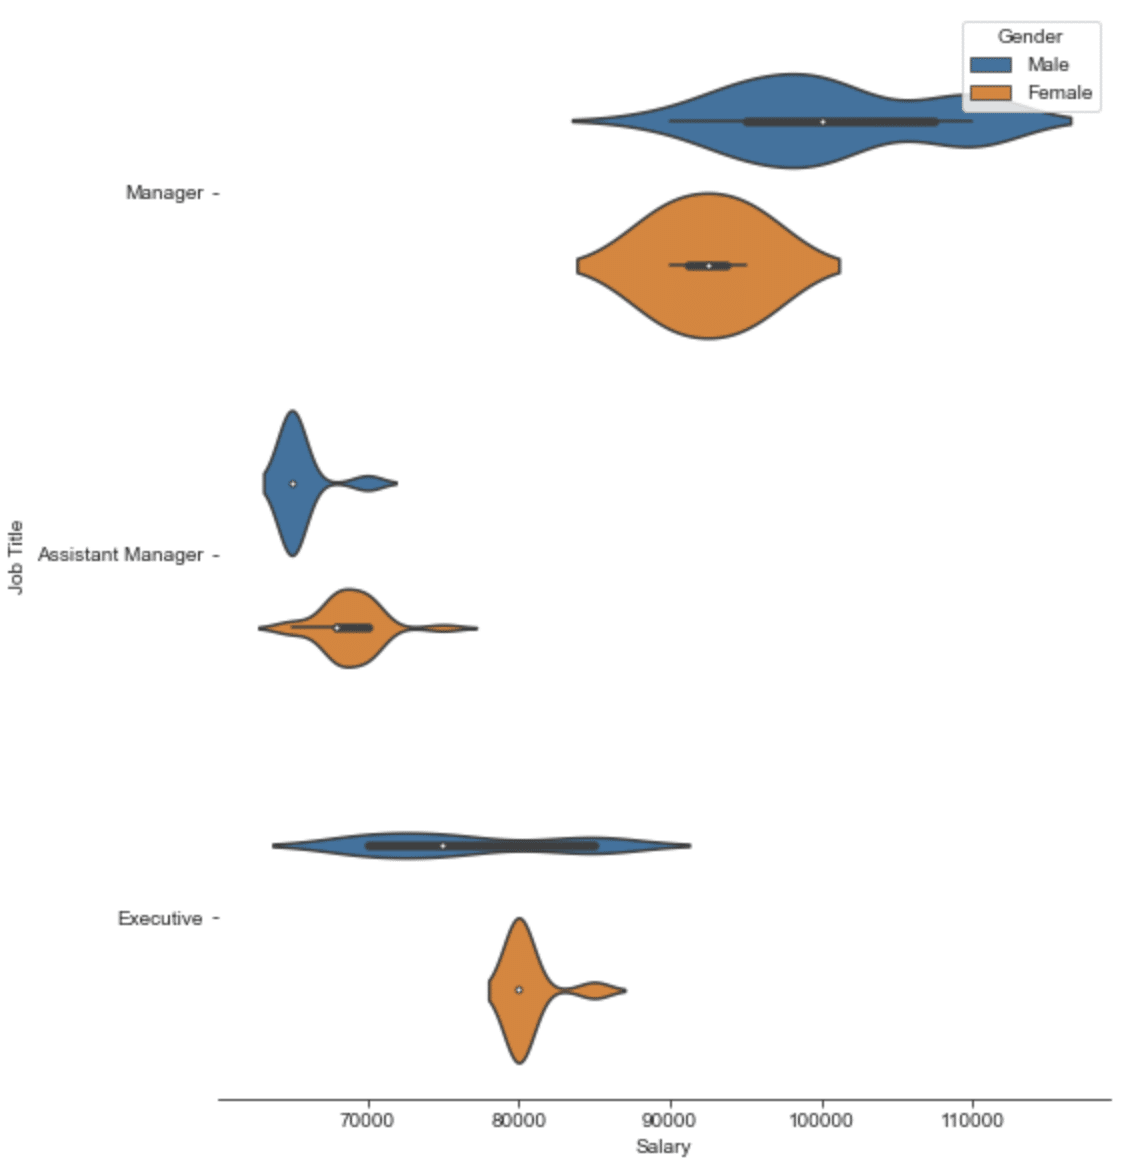
The salary gender gap looks pretty clear for the managers. So that might be something the company would want to look into if they were to avoid any HR issues.
The code I used for the second plot:
import seaborn as sns
import matplotlib.pyplot as plt

# Create a violin plot using seaborn
sns.set_style("ticks")
fig, ax = plt.subplots(figsize=(8, 10))
sns.violinplot(x='Salary', y='Job Title', hue='Gender', data=df)

# Remove the grid lines
sns.despine(left=True)

# Show the plot
plt.show()
Use case 3: Understanding customer behavior for a financial services company
Problem statement
A financial services company wants to understand its customer behavior. They have data on customer demographics, financial products, and transaction history. They want to use this data to gain insights into their customer behavior and make informed decisions about their financial products.
Data analysis using pandas profiling
The customer data is loaded into a pandas data frame and a pandas profiling report is generated.
The report provides a summary of the data, including the number of missing values and the distribution of variables. It also highlights the relationships between variables and the correlations between them.
Key insights derived from the pandas profiling report
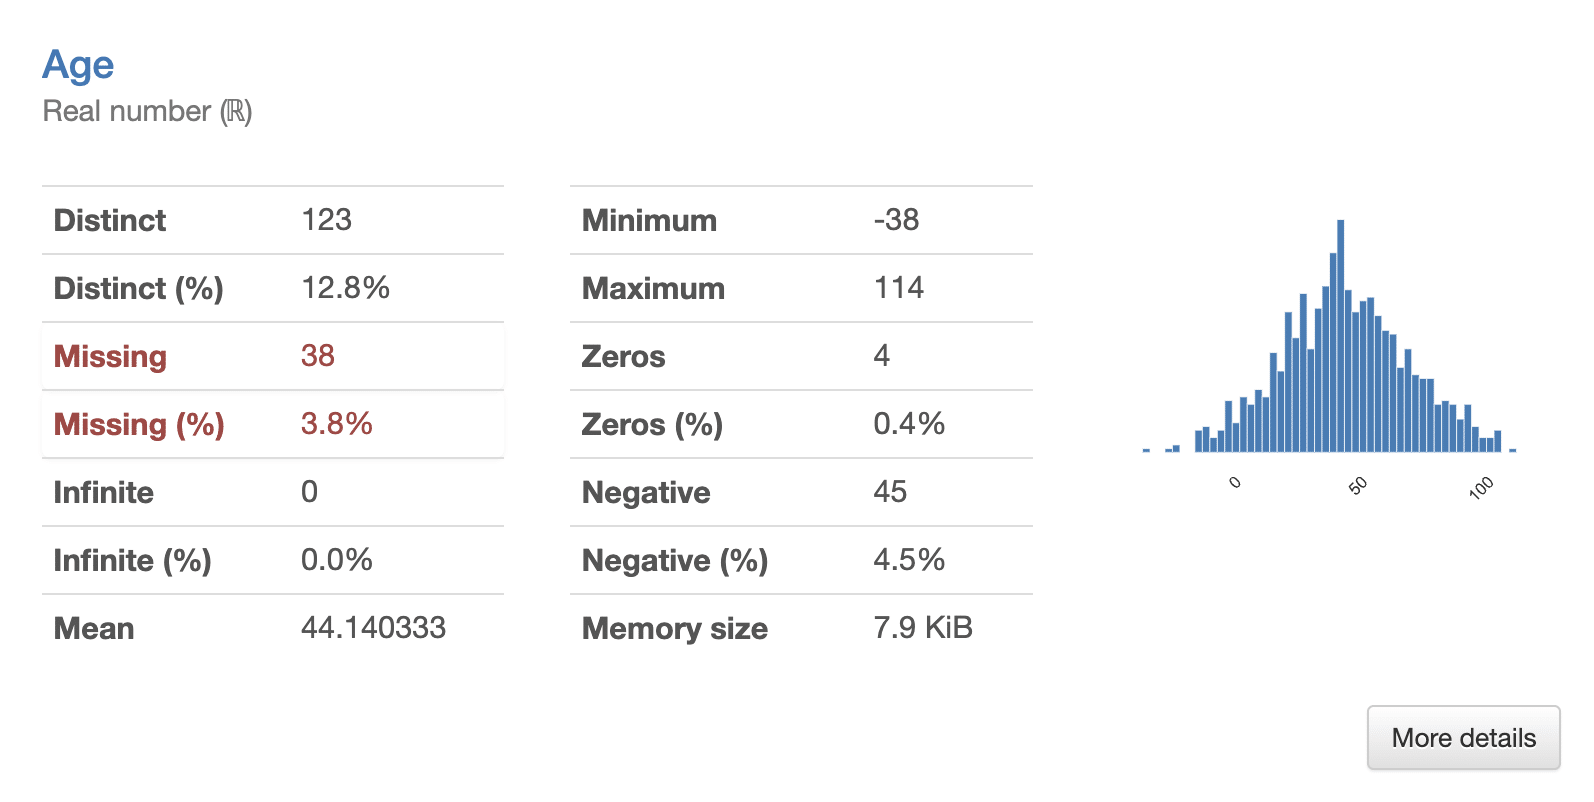
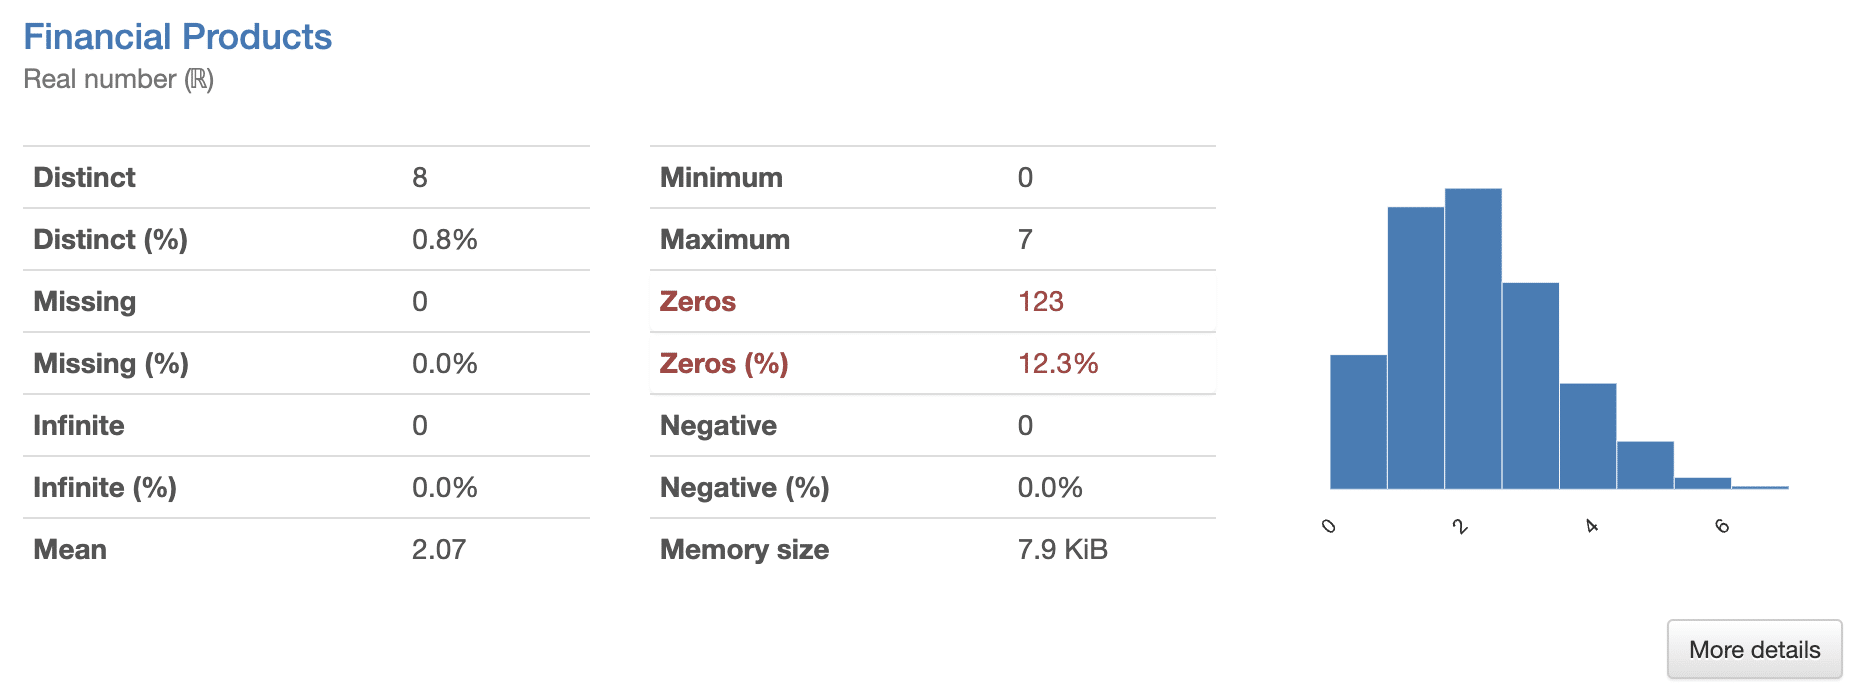
The pandas profiling report reveals that the majority of customers are middle-aged and have multiple financial products.
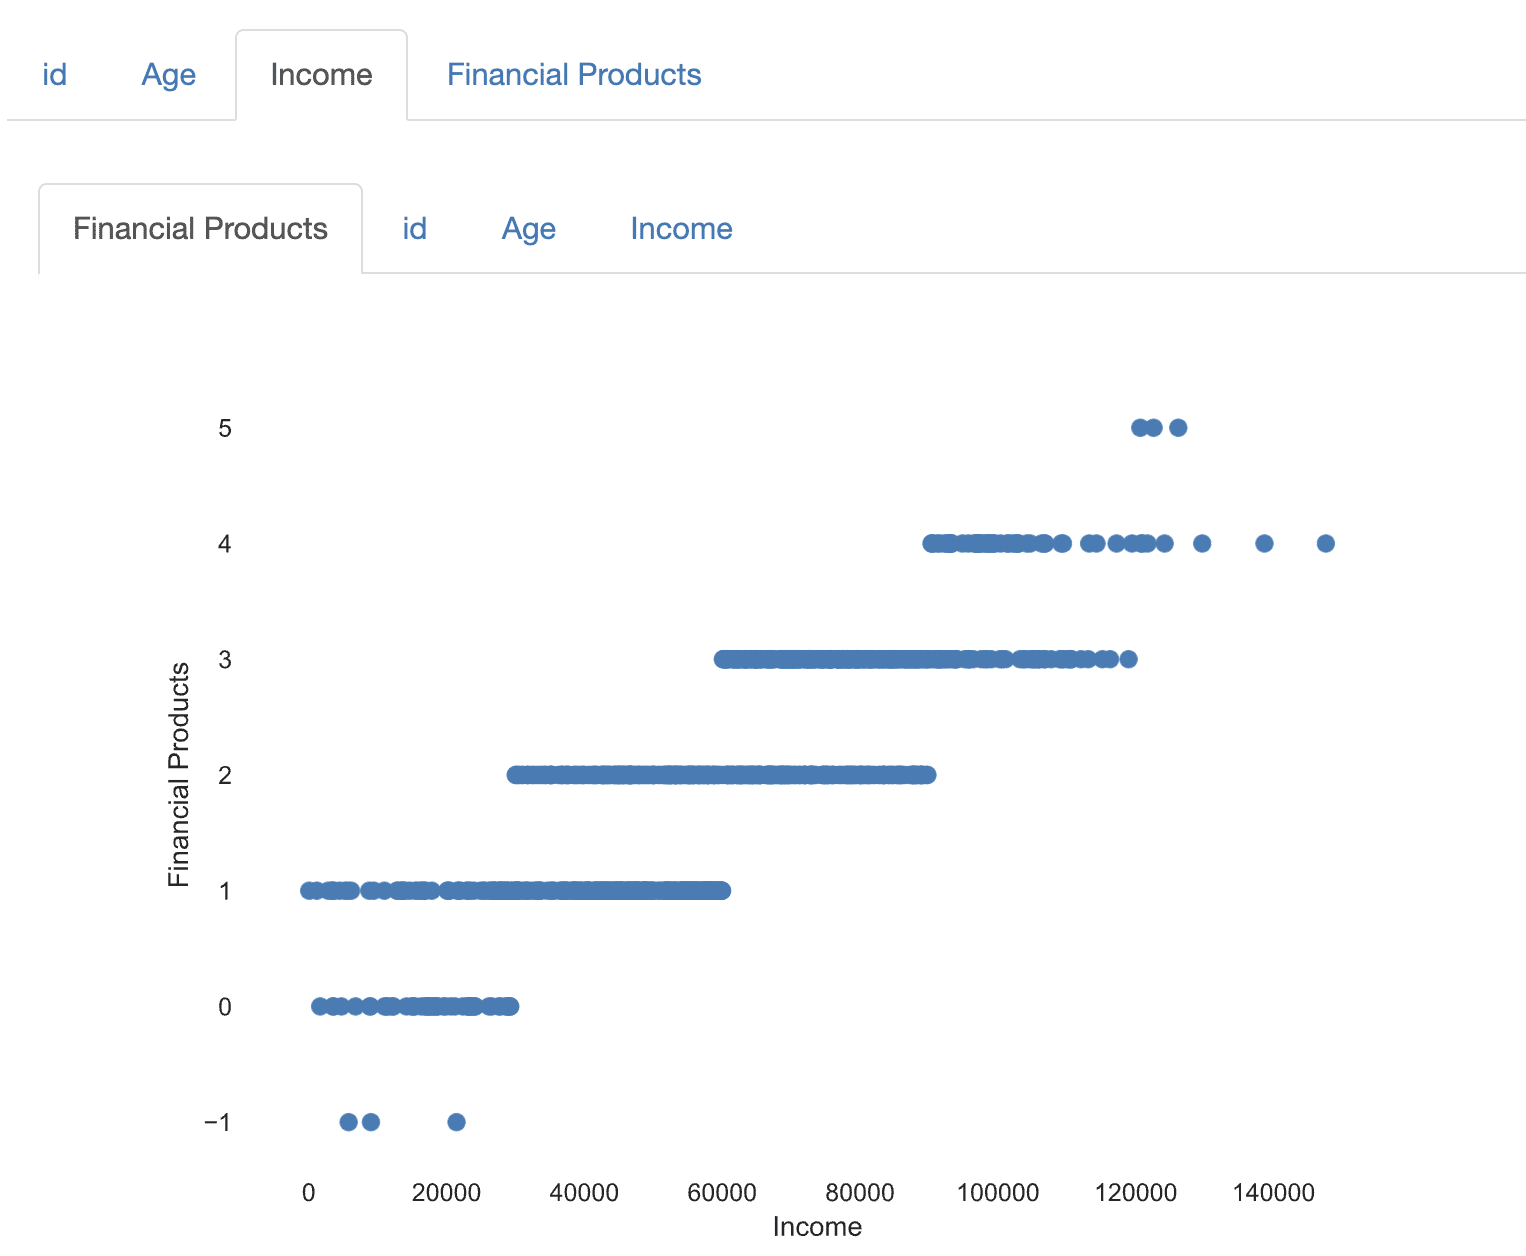
It also shows that there is a strong correlation between customer demographics and financial products, with higher-income customers having a higher likelihood of purchasing multiple financial products.
You can read more about visualizing financial data in this post (using mainly Tableau).
Conclusion
Pandas profiling is a powerful tool for data analysis and exploration. The three use case examples presented in this blog post demonstrate the benefits of using pandas profiling in real-world data analysis projects.
The reports generated by pandas profiling provide a comprehensive summary of the data, highlighting key insights, relationships, and correlations in the data.
This makes pandas profiling an essential tool for any data analyst looking to efficiently and effectively explore and understand their data.
Highly passionate about data, analysis, visualization, and everything that helps people make informed decisions.
I love what I do! I am working to improve speed in every aspect of my life and that of our clients.
I find comfort in helping people, so if you have a question, give me a shout!