Are you into investing? Or maybe curious about how a part of the stock market is doing? An interactive stock dashboard might be the ideal project for you.
Tableau is a data visualization software that allows you to make interactive charts, graphs, and dashboards using data from all kinds of sources.
It allows you to mix, match, and explore data from multiple sources in ways that can help you uncover insights and trends.
You can customize the visualizations to give them a unique look and feel based on your own unique tase.
Google Sheets is a powerful spreadsheet application that can be used to store data online and keep it fresh. It’s integration with Google Finance makes it the perfect solution for the average user looking for a quick way to grab stock data.
In this blog post I am going to show you how I created my own watchlist in Tableau, and how you can “steal” it from me to fill it with your own data, for free.
Let’s get started!
Get me the data
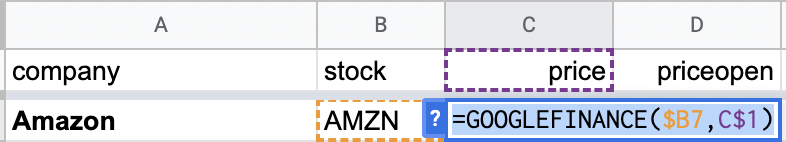
Here’s how the data looks in Google Sheets:
It’s based on the GOOGLEFINANCE function which communicates with the respective service. You don’t need any API key, authentication, add-on, etc.
It simply works. And it gets refreshed automatically every 5 minutes.
I created a template you can grab from here.
To fill it with your own stocks all you need to do is to write the company
name and the ticker in a new row.
It’s important to type the ticker correctly because that’s the column used in the function that downloads the data.
The Tableau part
Hold on, did I mention you can do this for free? But Tableau is a paid software.
Well, Tableau Public is free. You can download it from here and go to town.
While it’s mainly designed for static snapshots of data, you can set it up to refresh automatically when connected to Google Sheets.
How, you ask?
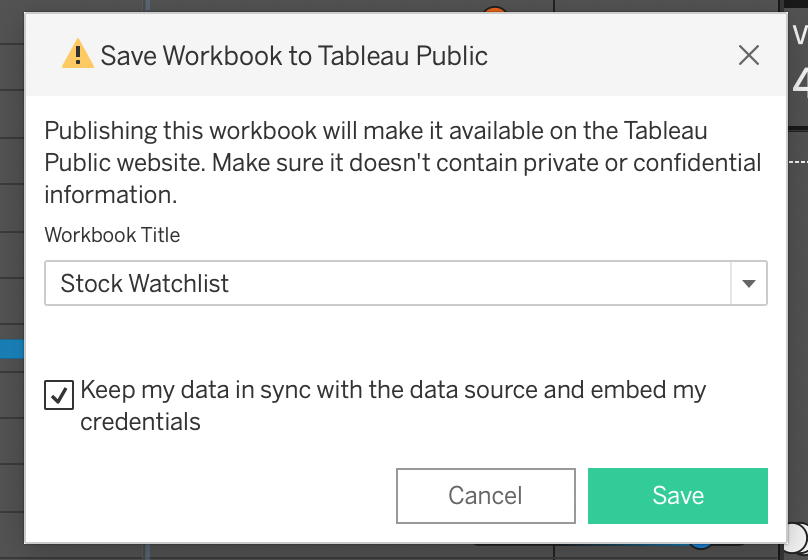
All you need to do is to make sure you have this option checked when saving to Tableau Public: “Keep my data in sync with the data source and embed my credentials”.
Remember that you only get to see this checkbox when connecting to Google Sheets.
Connecting Tableau to Google Sheets
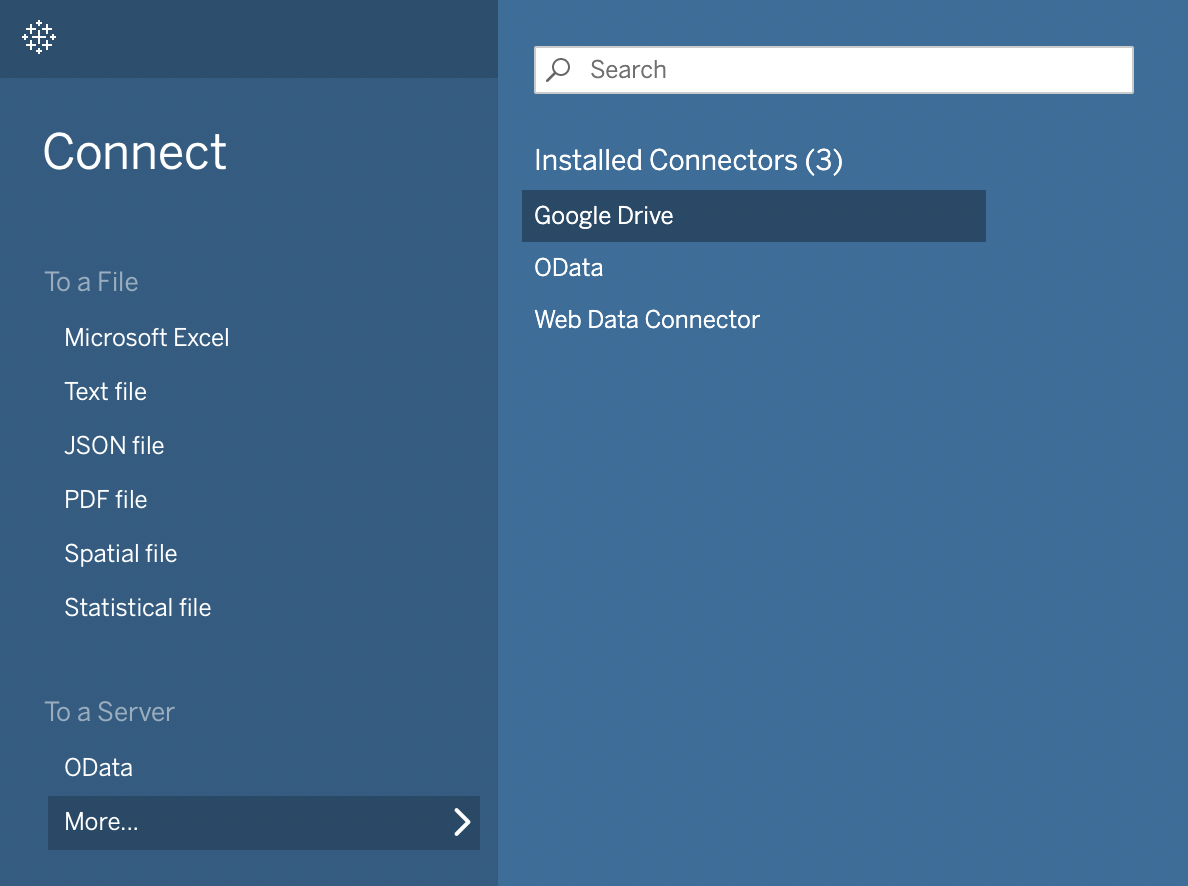
The first step is to connect Tableau to the Google spreadsheet. Select ‘Google Drive’ under ‘Connect’ (To a Server)
You will be taken to the browser to authenticate and after that you should be able to search for your Google Drive files in Tableau.
Once we connect the sheet, we can jump straight into working with the data in Tableau.
The Visualization
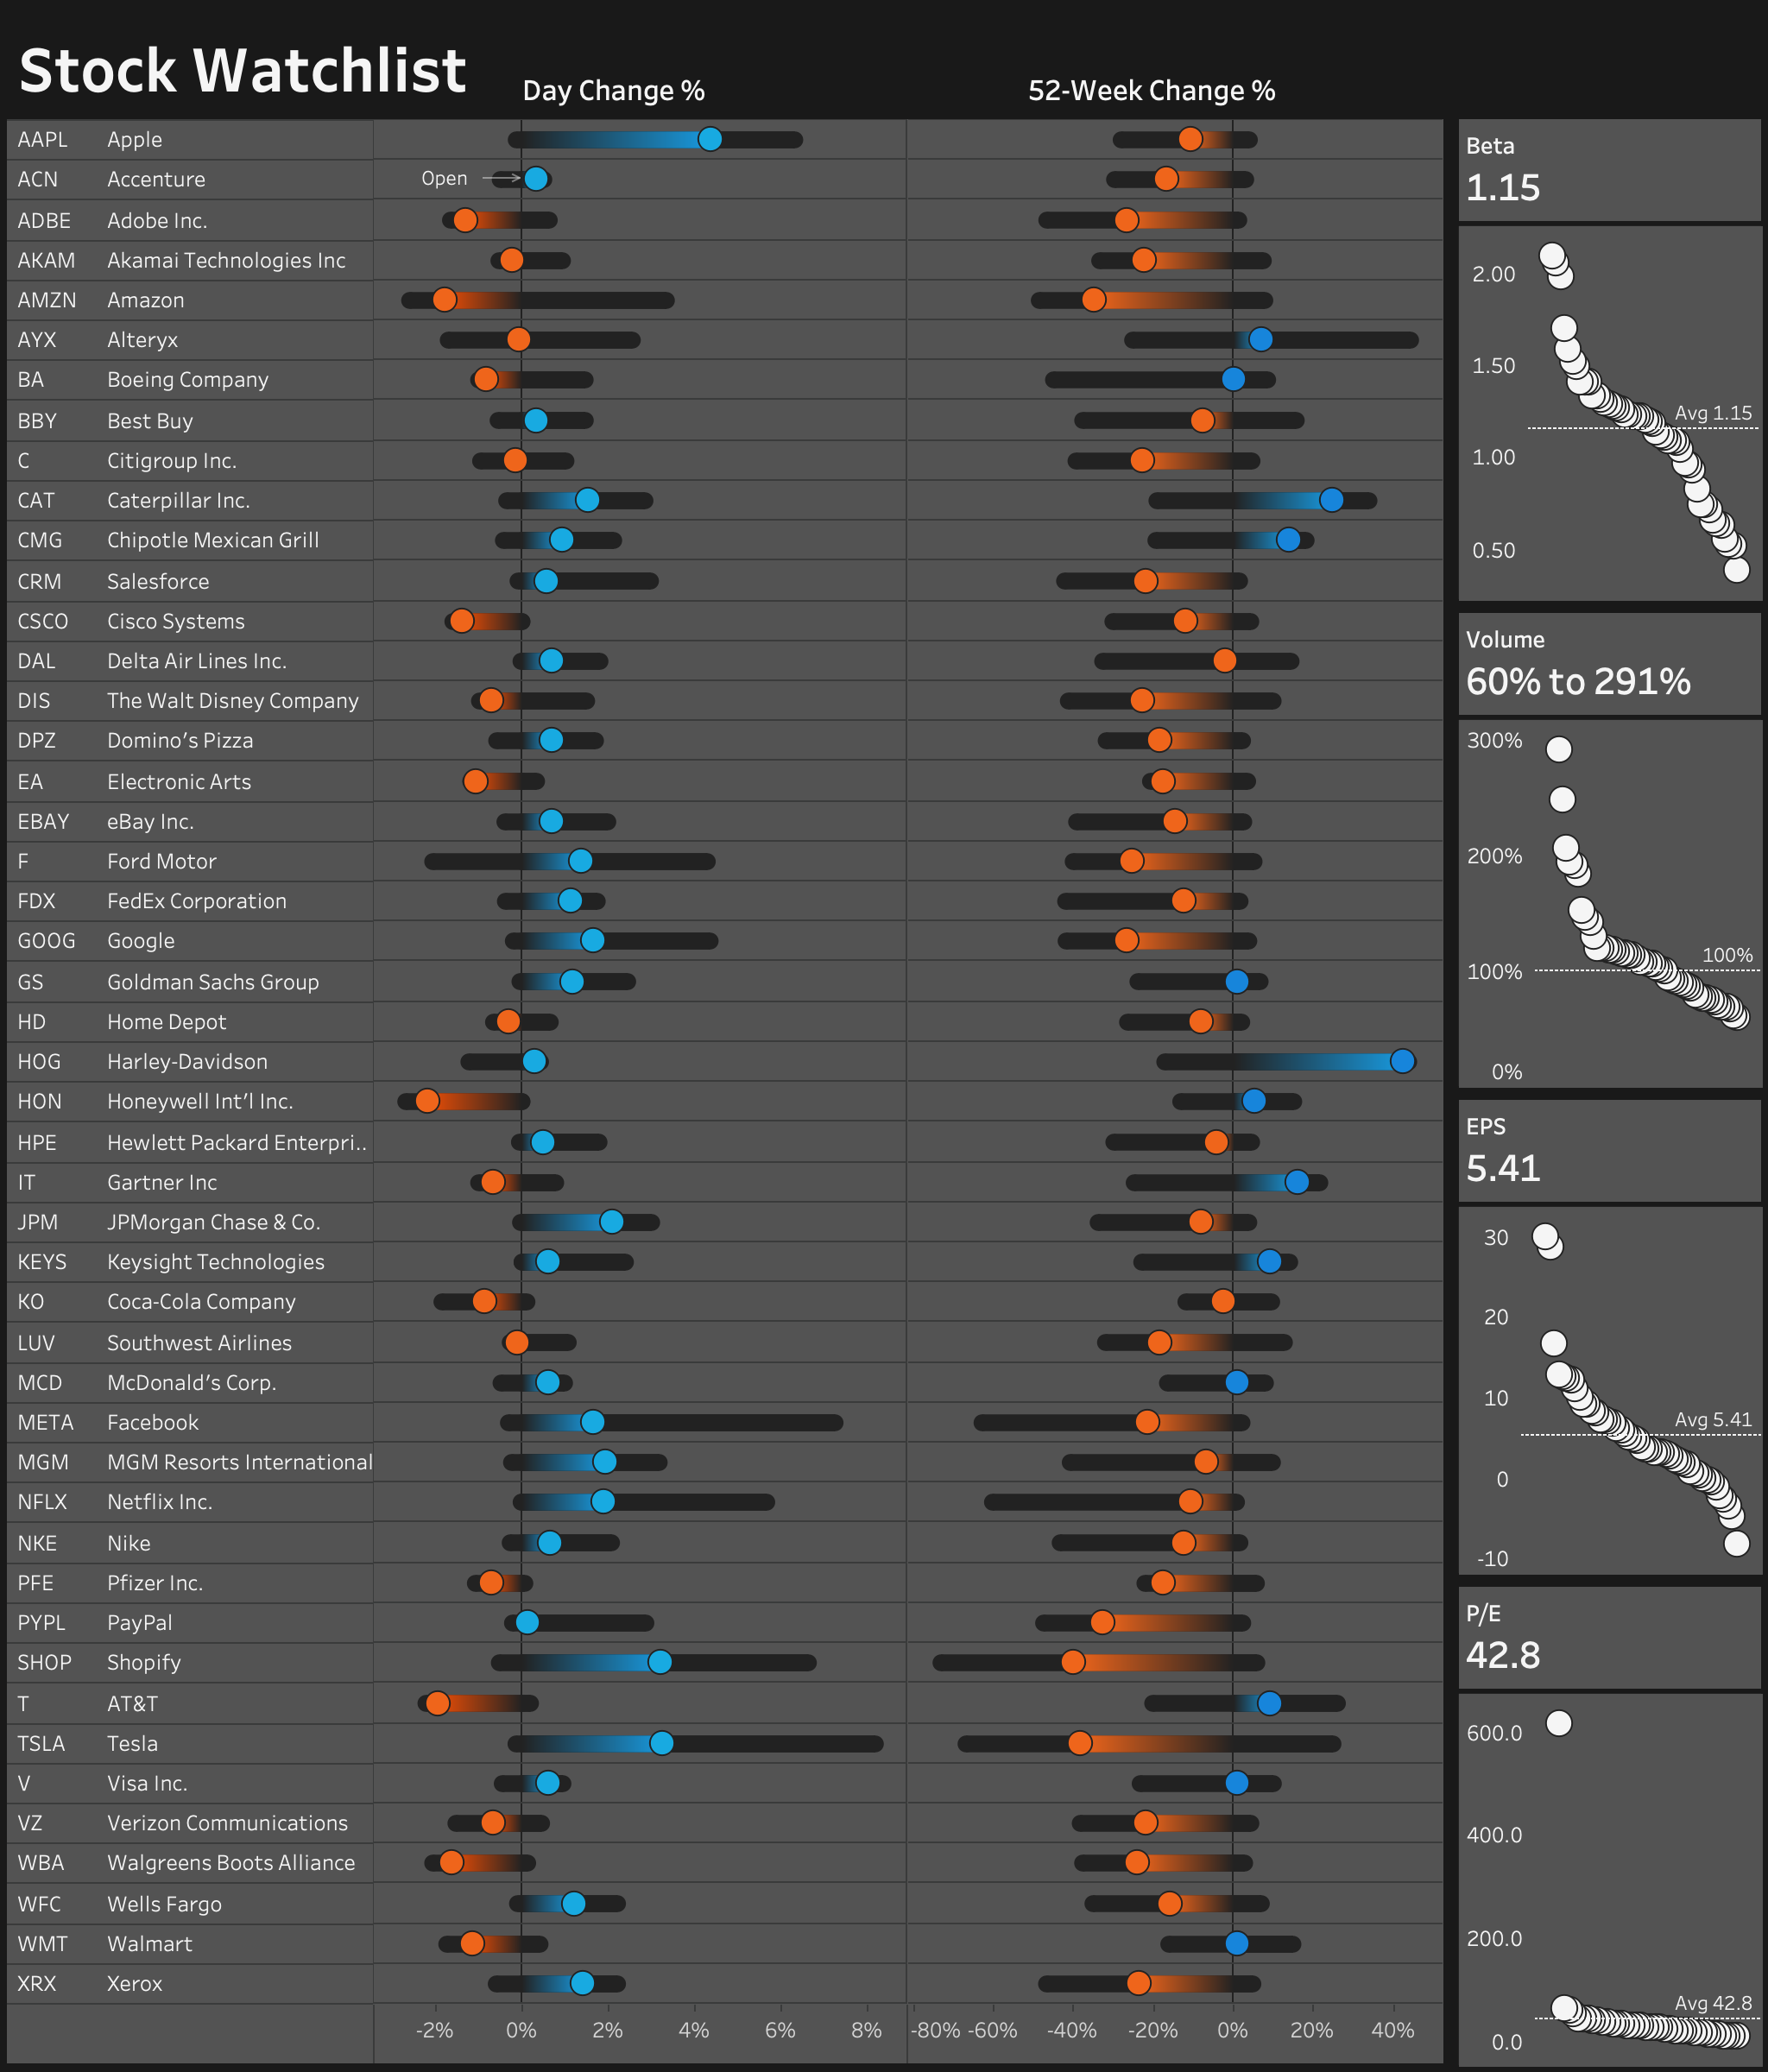
Here’s what I came up with:
The dashboard is packing a lot of information about a bunch of stocks (47 in this case).
The left side shows the relative change for each of the stocks for the past day and the past 52 weeks.
Let’s take this subset as an example:
On the left we can see that Google, FedEx, and Google have increased in the past day.
The right side puts it in a broad context: all three stocks have dropped in the past year.
There’s also an additional section across the right side with charts on Beta (Risk metric), Volume traded, EPS (earnings per share), P/E (price to earnings ratio).
I believe this section shines when we select a specific stock from the left. Which leads us to one of my favorite parts of modern data visualization.
The Interactivity
Notice how clicking on a stock expands the space under it to show the details about price and change. It also highlights the item on the right-side charts.
In this way we get to see the details of the item we’re interested it, while highlighting it in the supporting right-side charts.
Implementing this kind of interactivity is not a walk in the park. I don’t recommend jumping into this without prior knowledge on these two Tableau features:
- Set actions to allow the user to pick a specific stock. Read more about it here.
- Data densification to allow for extra space below the selected stock which is used to show the labels. Read more in this article by Klaus Schulte and Rosario Gauna about internal data densification or watch this TC session from Jonathan Drummey.
One feature I could consider adding in the future is the dynamic sorting of the stock list which can be achieved using parameters.
If you don’t want to bother with all of this you can just download the dashboard I created from Tableau Public and go from there.
There you have it
A near real-time stock watchlist dashboard from start to finish.
Tableau and Google Sheets can be used together to create an interactive stock dashboard that can easily be shared and embedded into your own website or app.
With this setup you can keep track of your stocks using nothing but a browser, a Tableau Public and a Google account.
In this blog post I’ve showed you how to setup the data connection, create a data visualization, and use interactivity to get the most out of it.
Highly passionate about data, analysis, visualization, and everything that helps people make informed decisions.
I love what I do! I am working to improve speed in every aspect of my life and that of our clients.
I find comfort in helping people, so if you have a question, give me a shout!